


The 2018 Perl Developer Survey Results
The second edition of the Perl Developer Survey took place from the 5th of April until the 7th of May. Over 32 days we received 1024 responses from all over the world, an improvement over last year’s 849. There were several changes including a few new questions and also a large number of respondents from Japan who were almost completely absent in 2017.
Here are some of the highlights:
51.6% of respondents self taught in Perl
5.24 is the most popular Perl 5 version
JavaScript and Bash are the most popular secondary technologies
9.6% of respondents work in Perl teams larger than 49 people
Cambridge is the most popular city for Perl developers in the U.K.
Vim is again the most popular text editor
70% of respondents have a positive outlook on the Perl community
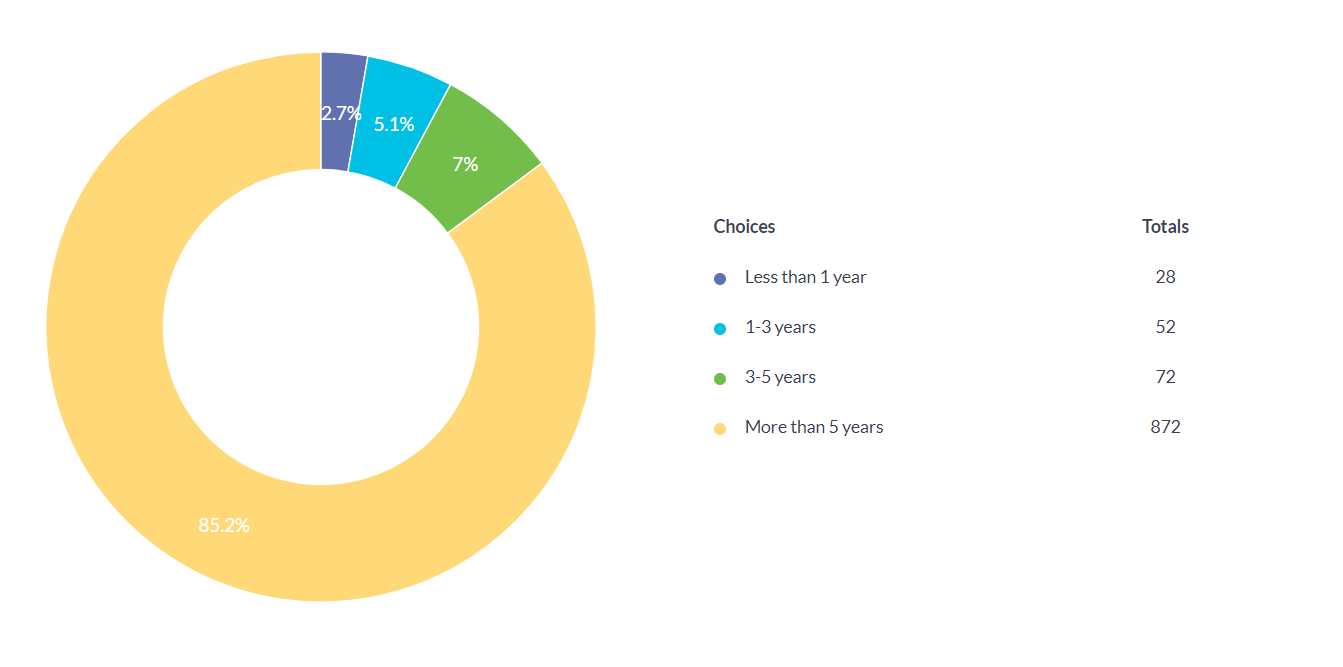
Q1 How long have you been using Perl 5?
| Experience | 2017 | 2018 |
|---|---|---|
| Less than 1 year | 3.8% | 2.7% |
| 1-3 years | 5.1% | 5.1% |
| 3-5 years | 7.1% | 7% |
| More than 5 years | 84% | 85.2% |
At the experience level there are only slight changes in the less than 1 year and more than 5 years brackets.
Q2 How did you start working in Perl?
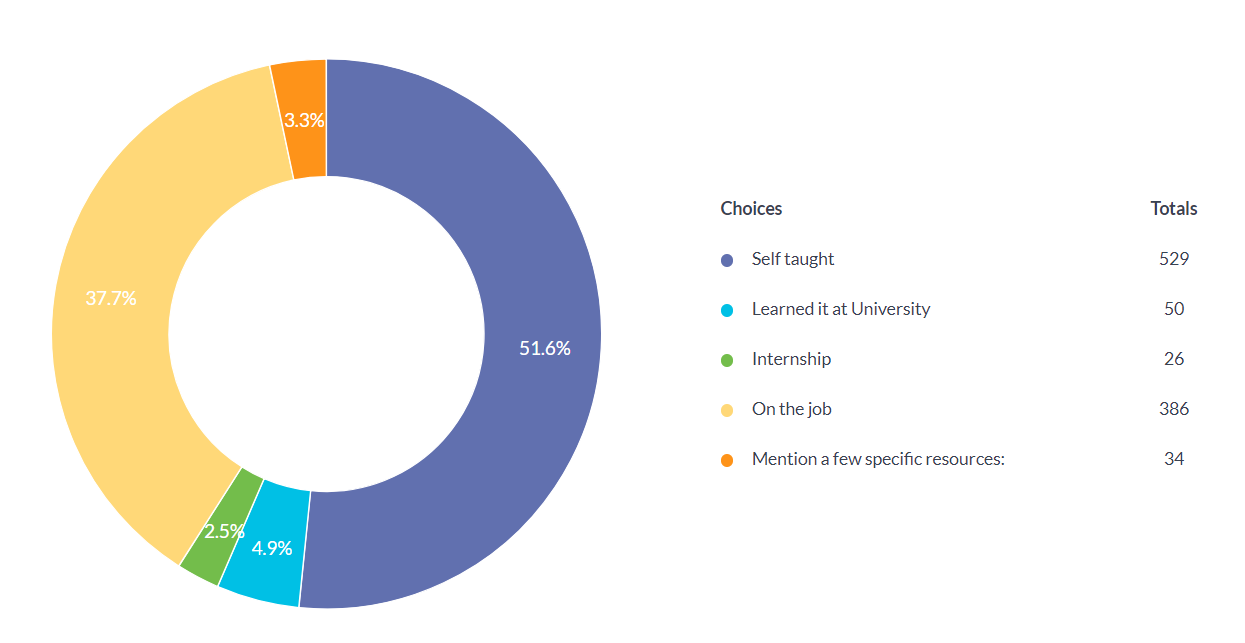
This is a new question, we wanted to know how developers got into Perl and what are the most popular ways of learning Perl.
The most popular choice, 51% is self taught, followed by on the job with 37.7%. Basically non formal choices have the majority. University is third with 4.9%, which is unfortunate, but not surprising.
Internships are dead last with 2.5%. A lot of companies using Perl are in need of talent, but growing new developers through internships is not a popular choice. The mention a few specific resources section brought answers mostly related to books, Learning Perl, the Camel book/Programming Perl, courses, Perl Mongers etc.
Q3 What resources would you recommend to someone new to Perl?
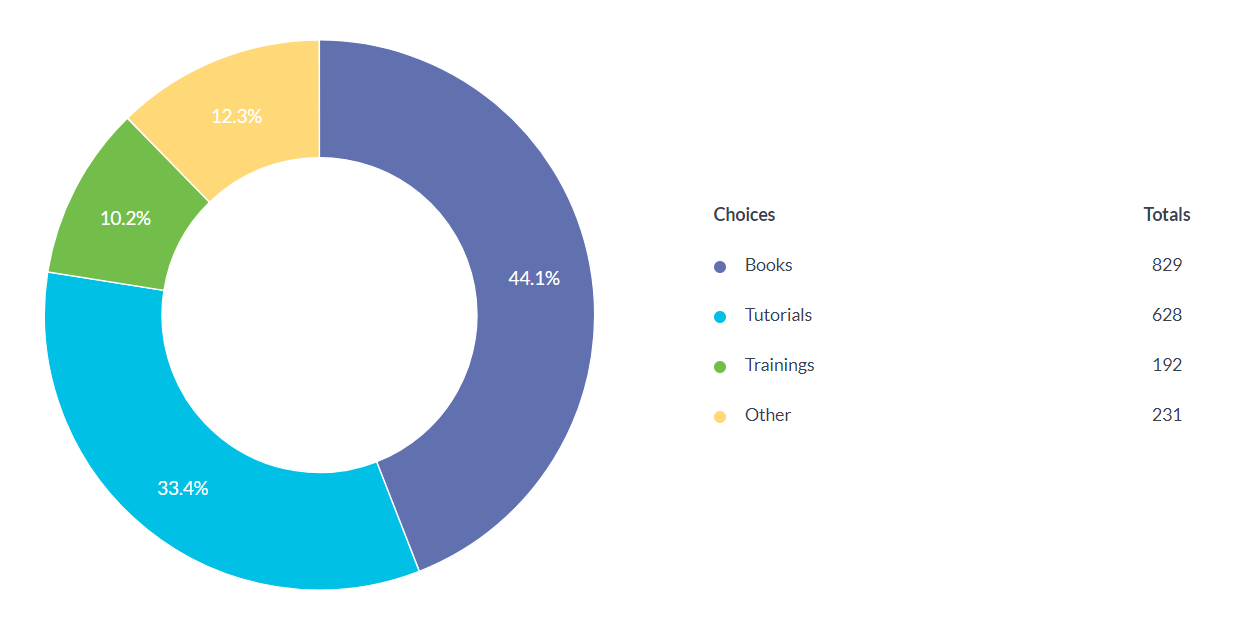
This question follows the same theme as the previous one, regarding resource and sources to learn Perl. Books are the most popular choice with 44.1%, followed by tutorials with 33.4% and training with 10.2%.
The other section brought answers like: Geekuni, IRC, mailing lists, Perl Monks, source code, conferences and others.
Q4 Have you tried Perl 6 or have any interest in trying it out in the future?
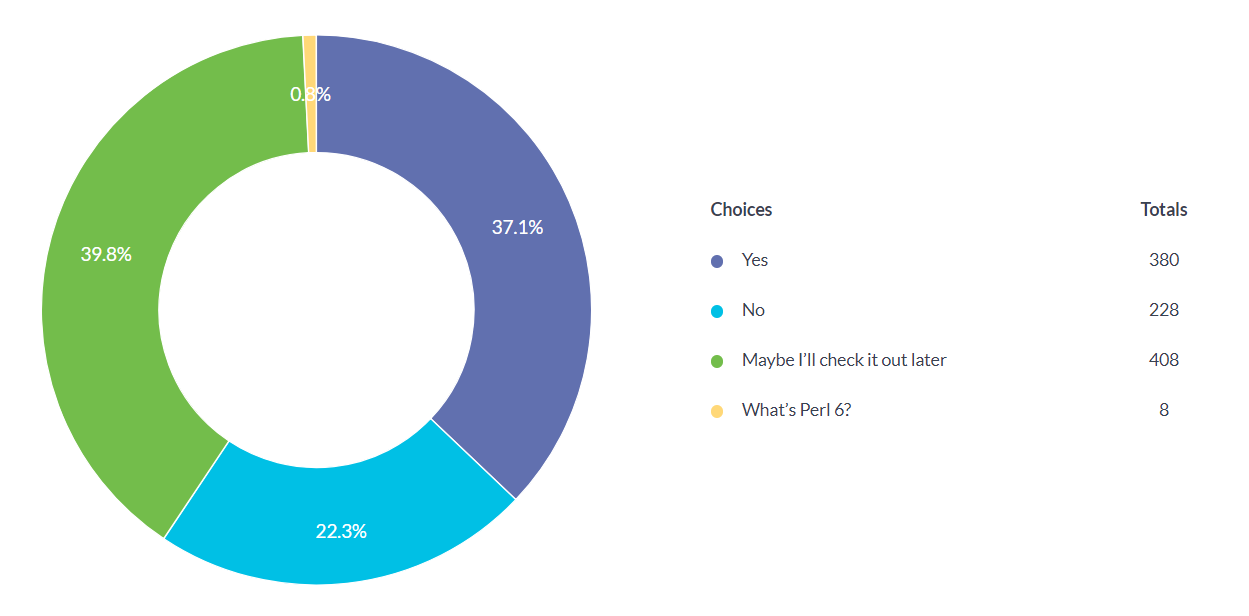
Here we have a slight change from 2017 that does not bode well for Perl 6, at least in this pool of respondents. The yes option dropped 9% from last year.
| Answer | 2017 | 2018 |
|---|---|---|
| Yes | 46.1% | 37.1% |
| No | 13.7% | 22.3% |
| Maybe I’ll check it out later | 39.6% | 39.8% |
| What’s Perl 6? | 0.6% | 0.8% |
Q5 What Perl 5 version do you use?
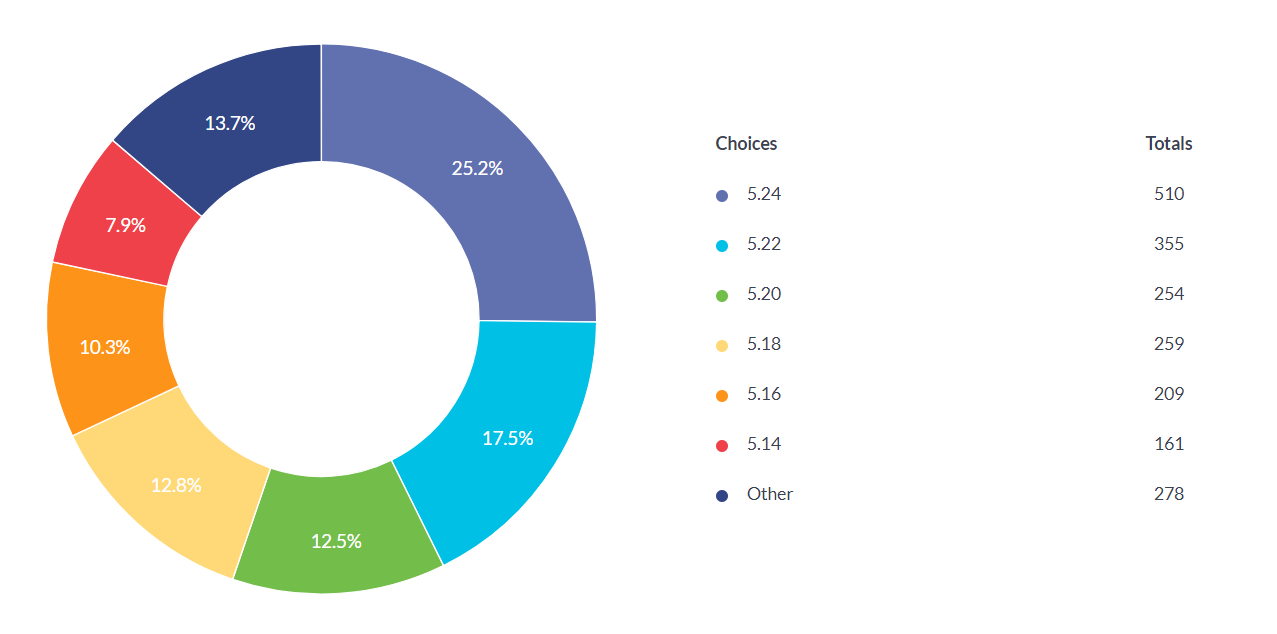
The most popular version is 5.24, while the latest version, 5.26, is second to last. The other section had various responses, including older version like 5.8, 5.1. In 2017 there was also an other option with mixed responses.
This was a multiple choice question.
| Perl 5 version | 2017 | 2018 |
|---|---|---|
| 5.26 | - | 9% (from other section) |
| 5.24 | 29% | 25.2% |
| 5.22 | 21% | 17.5% |
| 5.20 | 10% | 12.5% |
| 5.18 | 12% | 12.8% |
| 5.16 | 9% | 10.3% |
| 5.14 | 6% | 7.9% |
Q6 Is Perl 5 your main language?
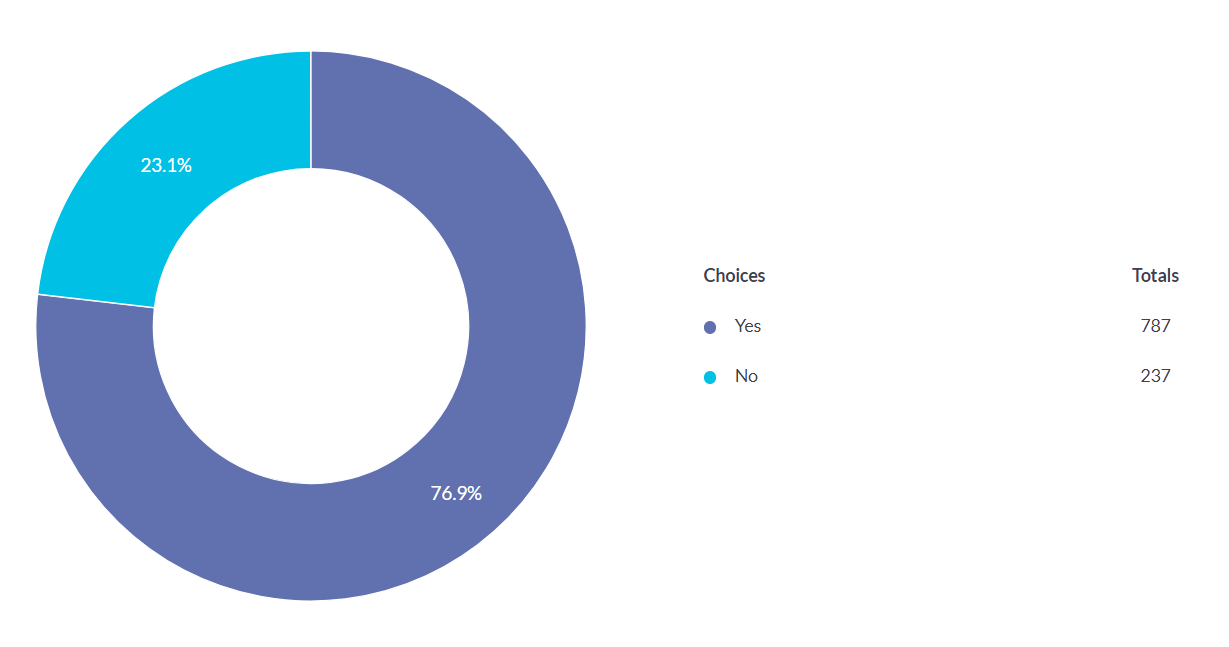
76.9% of respondents use Perl as a main language, while 23.1% don’t, a 0.1% difference from last year, when 77% chose yes and 23% no.
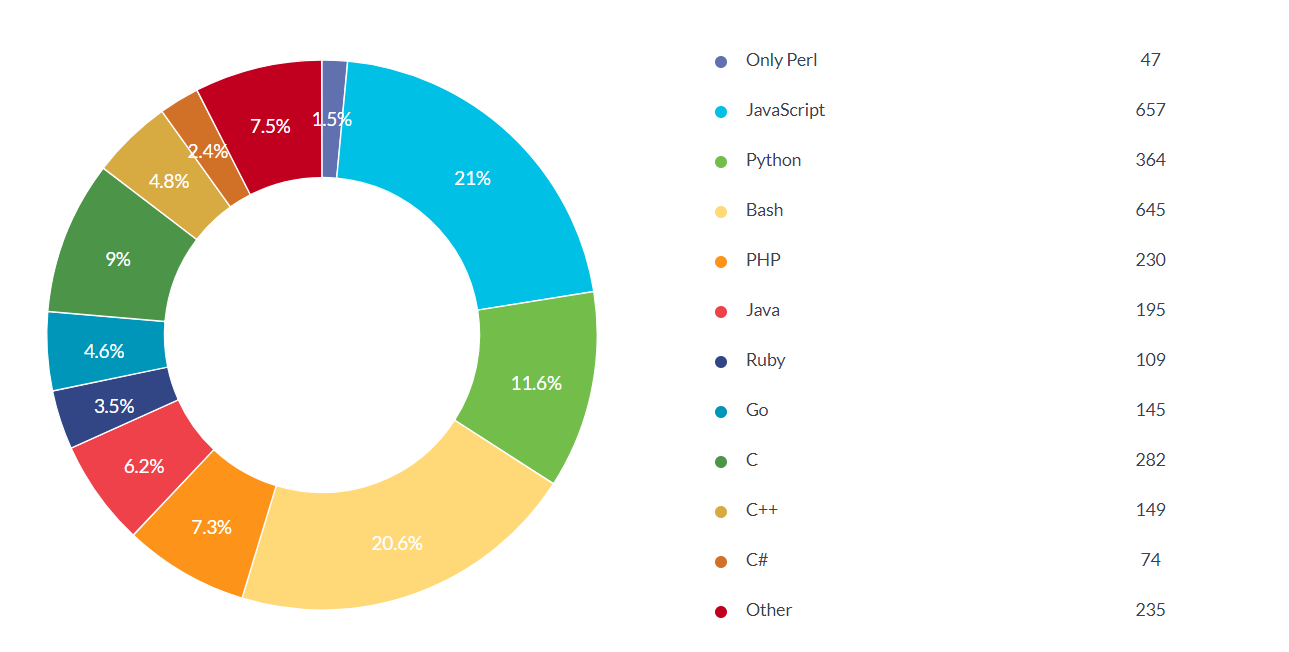
Q7 What other languages do you use?
| Languages | 2017 statistics | 2018 statistics |
|---|---|---|
| Only Perl | 10.8% | 1.5% |
| JavaScript | 22% | 21% |
| Bash | 8% | 20.6% |
| Python | 14% | 11.6% |
| C | 9% | 9% |
| PHP | 6.5% | 7.3% |
| Java | 5.5% | 6.2% |
| C++ | 6.6% | 4.8% |
| Go | 3.4% | 4.6% |
| Ruby | 4.4% | 3.5% |
| C# | 1.9% | 2.4% |
| SQL | 6.5% | 1% (from other section) |
The other section was quite diluted and contained responses like: Scala, Swift, Rust, Erlang, Perl 6, TypeScript, Lua, Fortran and others.
This was a multiple choice question.
Q8 What methodologies do you use?
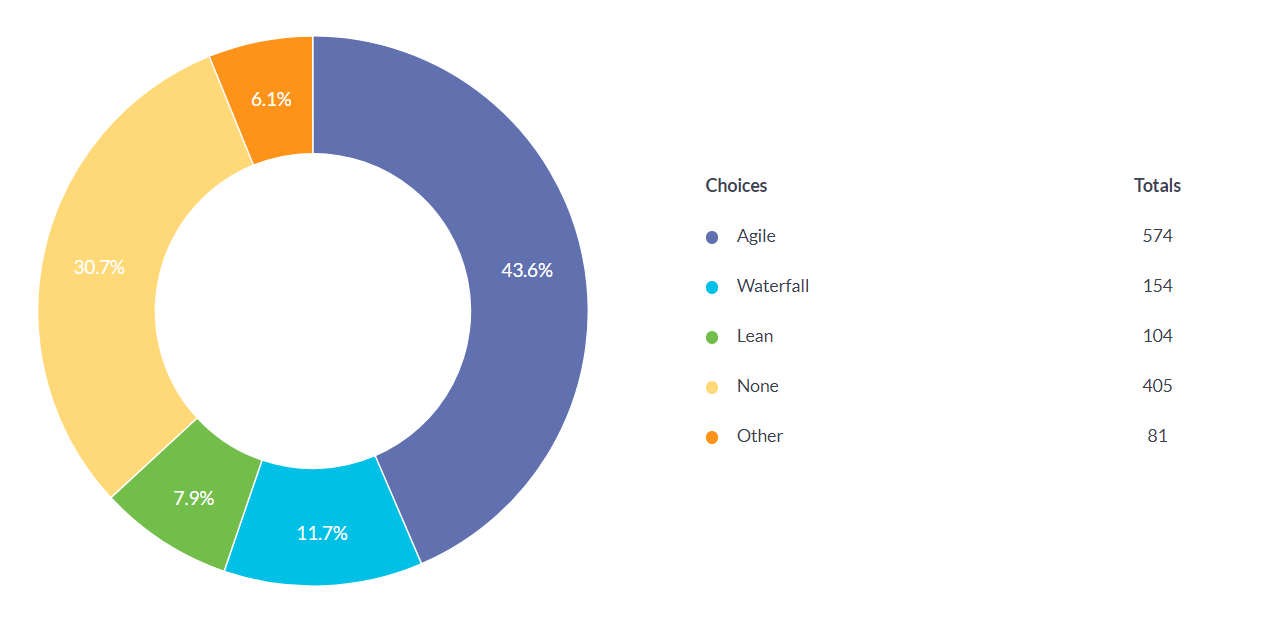
Methodologies correlate with how developers work and build software. That being said, 30.7% of respondents chose the none option. Most of them work in various size companies, but in small Perl development teams, which somewhat explains their choice. In the other section we received responses like: TDD, continuous delivery, spiral and various hybrid versions.
Agile is the most popular methodologies, followed by Waterfall and Lean.
Q9 Do you have a formal education in computer science?
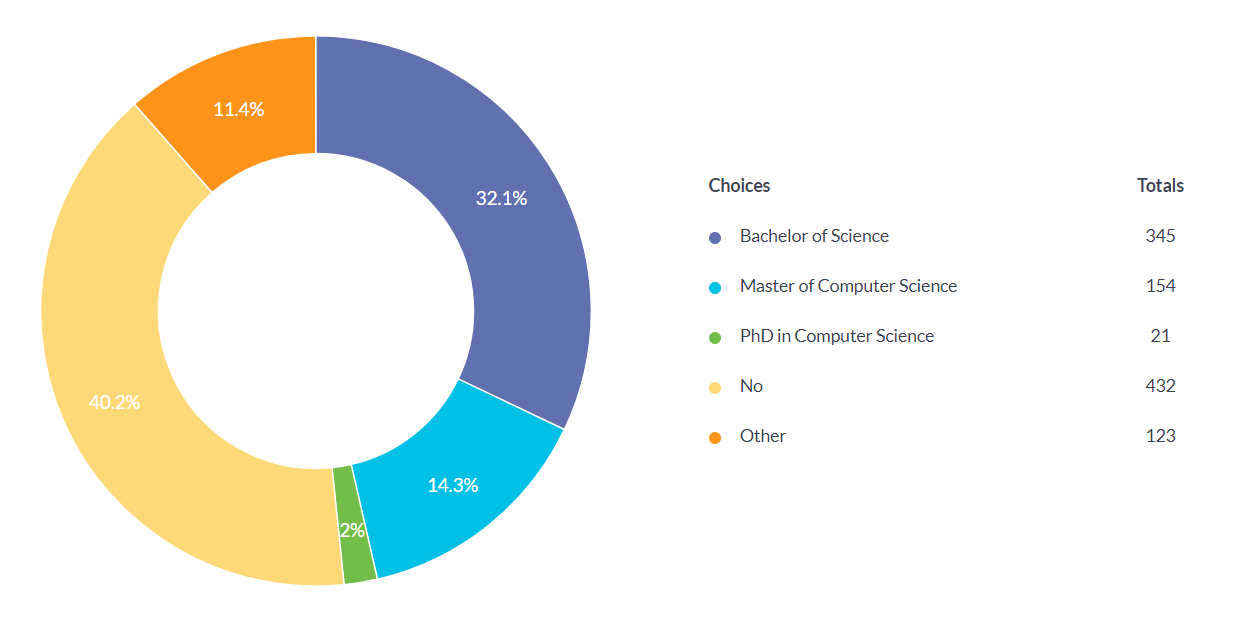
Most respondents, 40.2% don’t have a formal education in the field. Almost a third or 32.1% have a Bachelor degree, 14.3% have a Masters degree and 2% have a PhD.
In the other section we have responses like: mathematics, high school, engineering or incomplete degrees.
This was a multiple choice question.
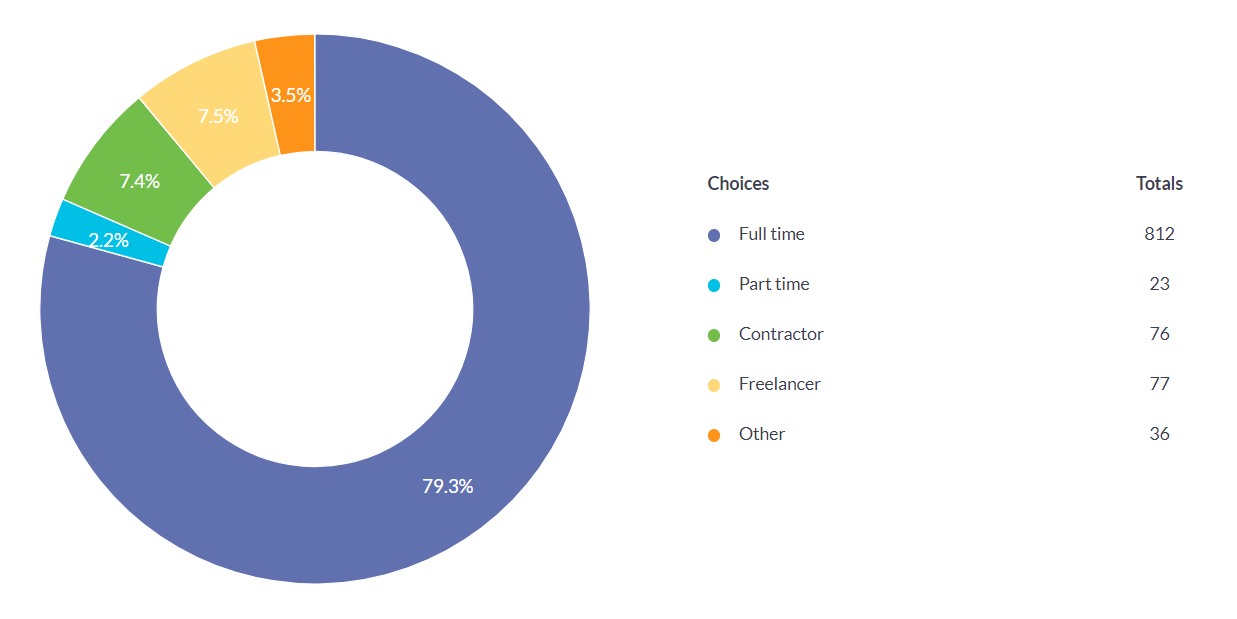
Q10 What’s your type of employment?
| Type of employment | 2017 | 2018 |
|---|---|---|
| Full time | 73% | 79.3% |
| Freelancer | 9.4% | 7.5% |
| Contractor | 8.6% | 7.4% |
| Part time | 2.8% | 2.2% |
| Other | 6.2% | 3.5% |
The full time section increased by 6.3% from last year, while the rest drop slightly.
The other section contained responses like: business owner, founder, student, between jobs or retired.
This was a multiple choice question.
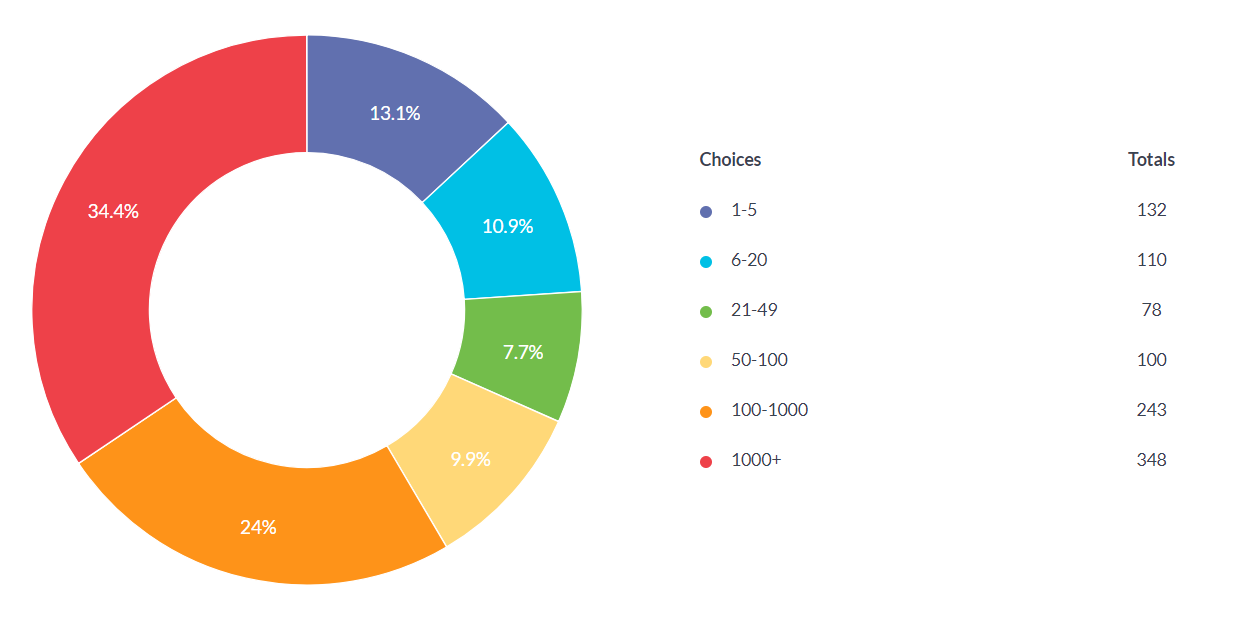
Q11 What’s the size of the company you work for?
| Company size | 2017 statistics | 2018 statistics |
|---|---|---|
| 1-5 | 15% | 13.1% |
| 6-20 | 10.1% | 10.9% |
| 21-49 | 8.6% | 7.7% |
| 50-100 | 10.2% | 9.9% |
| 100-1000 | 25.6% | 24% |
| 1000+ | 30.5% | 34.4% |
Company size statistics remain quite stable, with minor alterations, a 1.9% drop in very small companies, and a 4.1% gain in large companies.
1011 respondents answered this question
Q12 How large is the development team in the company?
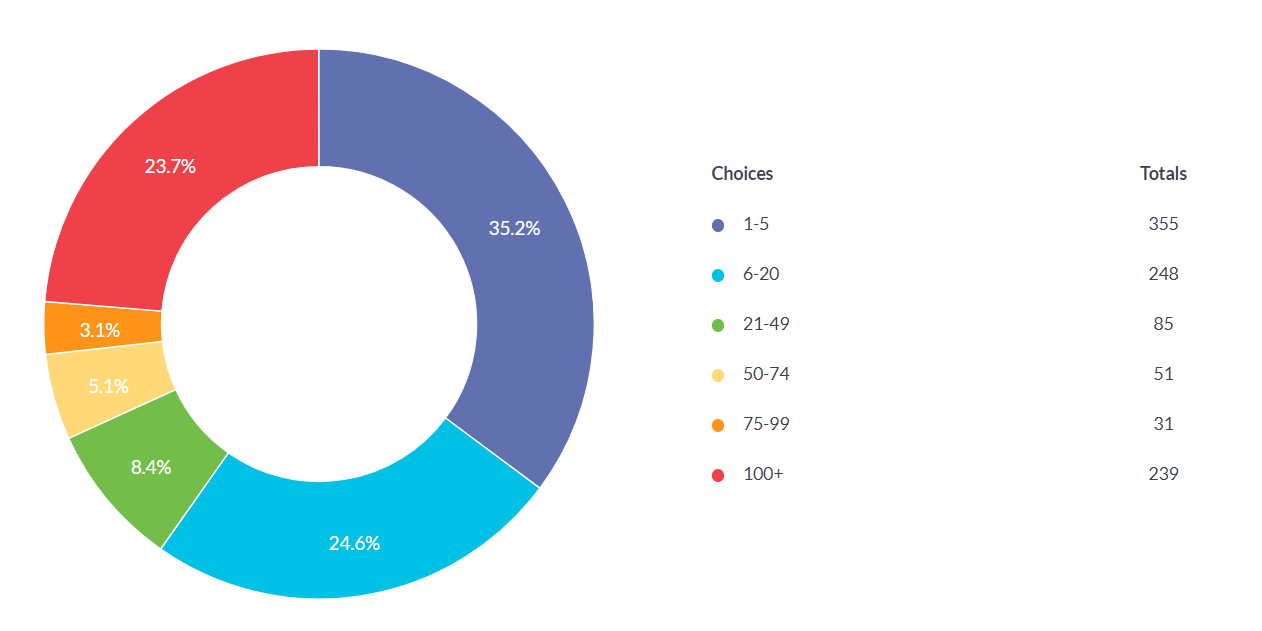
| Dev team size | Percentage |
|---|---|
| 1-5 | 35.2% |
| 6-20 | 24.6% |
| 21-49 | 8.4% |
| 50-74 | 5.1% |
| 75-99 | 3.1% |
| 100+ | 23.7% |
We wanted to know large is the overall development team. About 60% of development teams are under 20, while 23.7% are larger than 100.
1009 respondents answered this question
Q13 How large is the Perl team in the company?
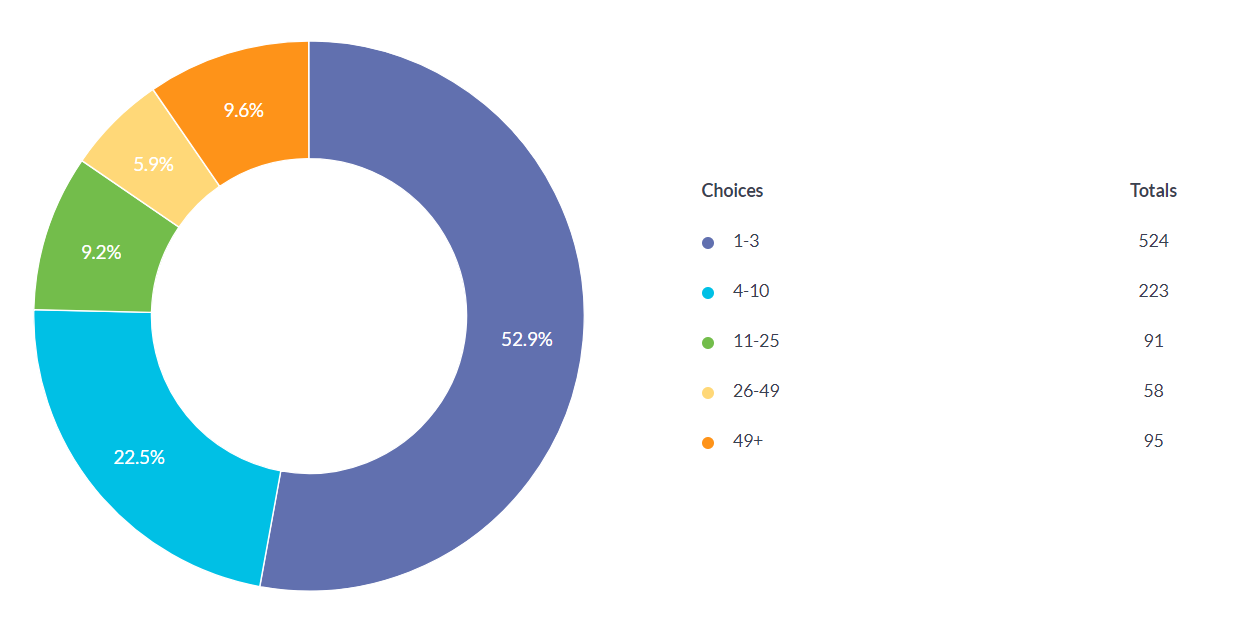
| Perl team size | Percentage |
|---|---|
| 1-3 | 52.9% |
| 4-10 | 22.5% |
| 11-25 | 9.2% |
| 26-49 | 5.9% |
| 49+ | 9.6% |
991 respondents answered this question
Not all respondents answered all three questions, hence there are small discrepancies between them, i.e they do not all add up to 100%.
This is the last question in a set. By comparing company size to development team size to Perl team size we wanted to know how significant is Perl in the development process.
Development team size compared to company size
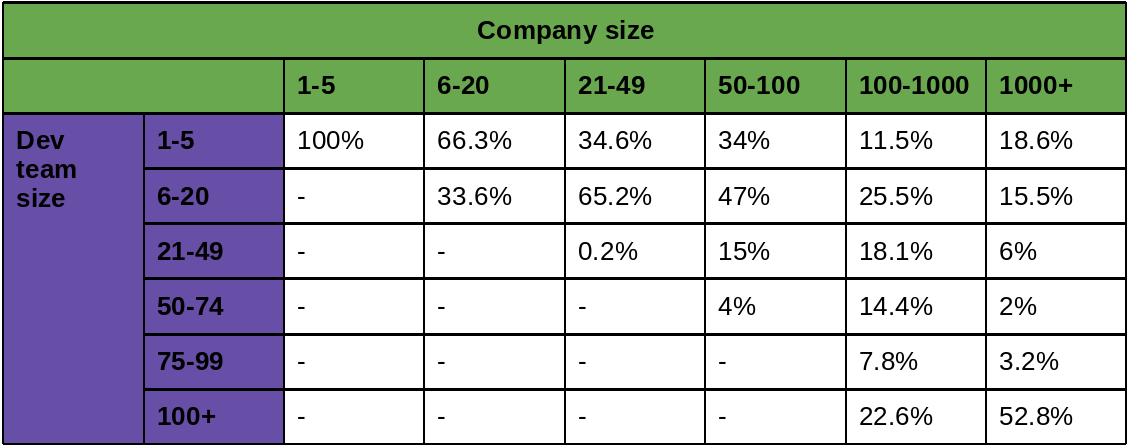
The 1000+ size bracket offers the most surprising result, more than half have quite large development team, with more than 100 people, but about 34% also have very small dev teams, with less than 20 people.
Perl team size compared to company size
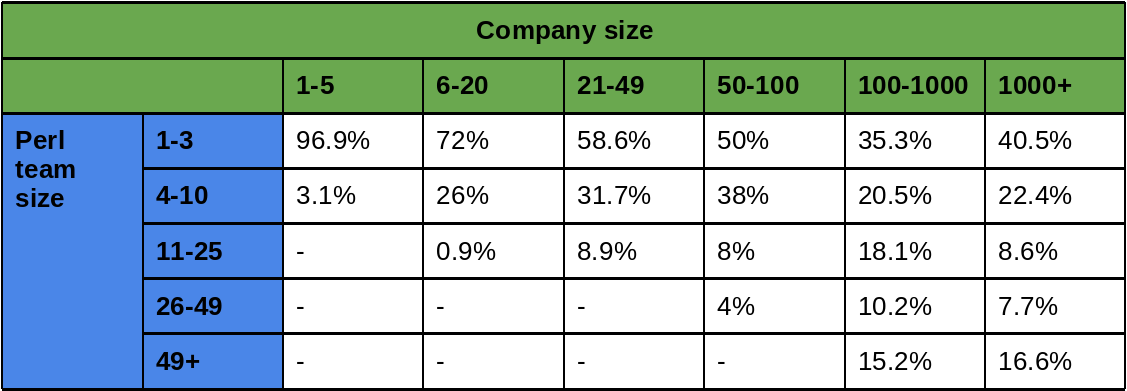
Small Perl teams are the most popular choice, no matter of company size. Very large Perl teams, 49+, are found in the 100-1000 and 1000+ company size brackets, with 15.2% and 16.6% respectively.
Perl team size compared to development team size
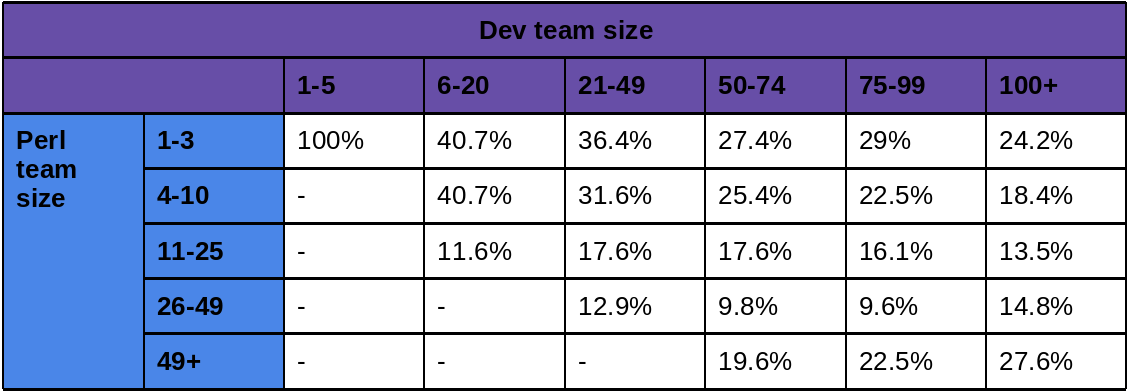
Comparing the Perl team size to the development team size shows how important is Perl as a technology. Most development teams contain small Perl teams, 1-3 and 4-10 Perl teams are the most popular choice. When it comes to large development teams (75-99 and 100+) Perl represents either a very small part, a 1-3 team/4-10 team or a very large part 49+.
For large Perl development teams, the 49+ bracket, the most popular countries are: the United States with 47%, United Kingdom 16.8%, the Netherlands 8.4%, and Japan and France 4.2% respectively.
Q14 What’s the field of the company?
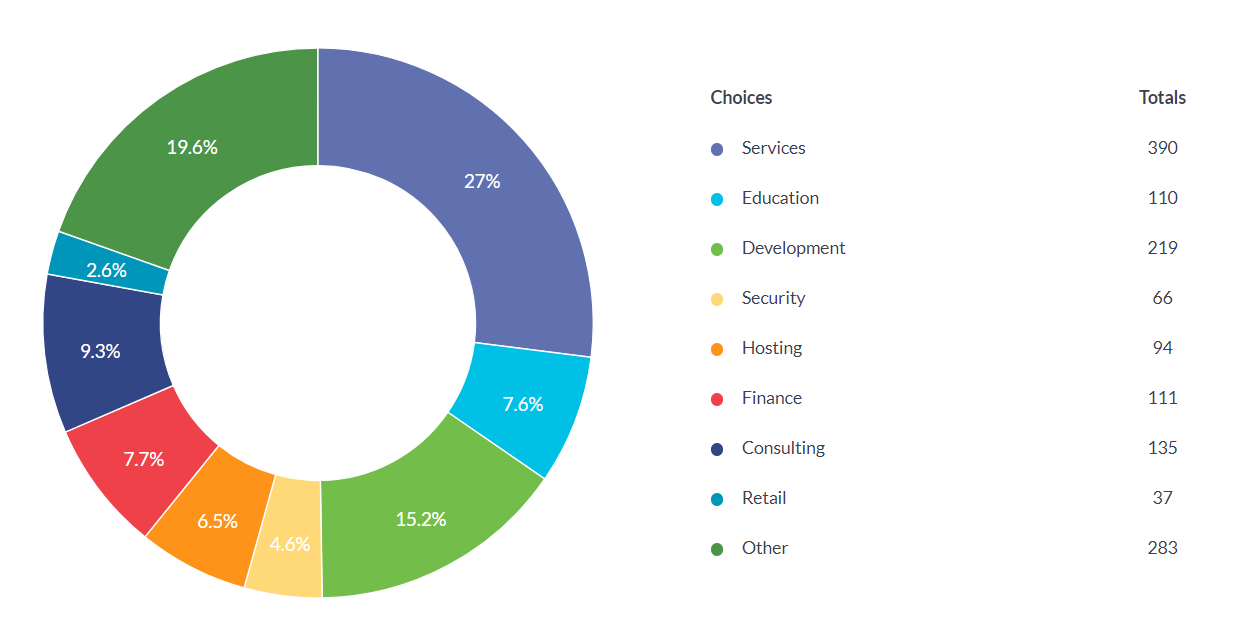
Last year this question had a write in option, with a larger variety of answers that didn’t all quantify to anything significant statistically speaking. Hence, this comparison shows some significant differences.
| Field | 2017 | 2018 |
|---|---|---|
| Services | 6.3% | 27% |
| Development | 23% | 19.6% |
| Consulting | 1.9% | 9.3% |
| Finance | 4.3% | 7.7% |
| Education | 4.7% | 7.6% |
| Hosting | 1.9% | 6.5% |
| Security | 2.5% | 4.6% |
| Retail | 1.4% | 2.6% |
| Research | 1.5% | 2% |
1008 respondents answered this question. This was a multiple choice question.
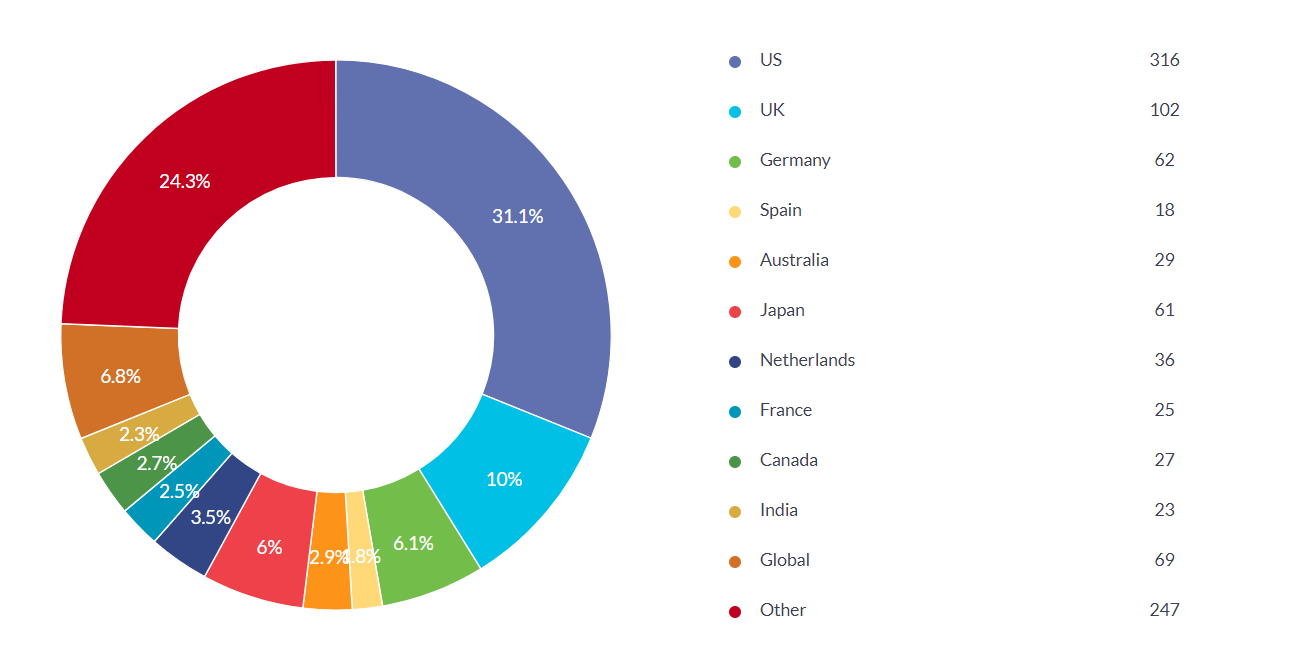
Q15 Where is the company based?
| Country | 2017 | 2018 |
|---|---|---|
| US | 33.9% | 31.1% |
| UK | 11.6% | 10% |
| Global | 2% | 6.8% |
| Germany | 8.2% | 6.1% |
| Japan | - | 6% |
| Netherlands | 2.9% | 3.5% |
| Brazil | 0.8% | 3.4% (from other section) |
| Australia | 3% | 2.9% |
| Russia | 1.5% | 2.8% (from other section) |
| Canada | 1.9% | 2.7% |
| France | 2.4% | 2.5% |
| India | 1.9% | 2.3% |
| Spain | 3.4% | 1.8% |
| Italy | 1.2% | 0.9% |
4.6% of respondents chose None as a location. The US again leads the board, followed by the UK and Germany. Japan makes an appearance as a large group of Perl developers joined this years’ survey, while Brazil increased its percentage. The other section had a variety of locations as well.
Most popular cities and states
Perl developers in the United States are spread all over the country, California, New York, Texas and Michigan remain popular states.
In the UK, Cambridge leads with 19% of respondents, followed by London with 17%. In Germany, Berlin has 12%, followed by Munich with 11%. In Japan 60% of developers reside in Tokyo. In the Netherlands 30% of developers reside in Amsterdam. In Brazil, Rio de Janeiro Is the chosen location of 25% of respondents followed by São Paulo with 22.8% and Belo Horizonte with 14.2%
We only took into account cities with a significant percentage in each country.
1014 respondents answered this question
Q16 What’s your age group?
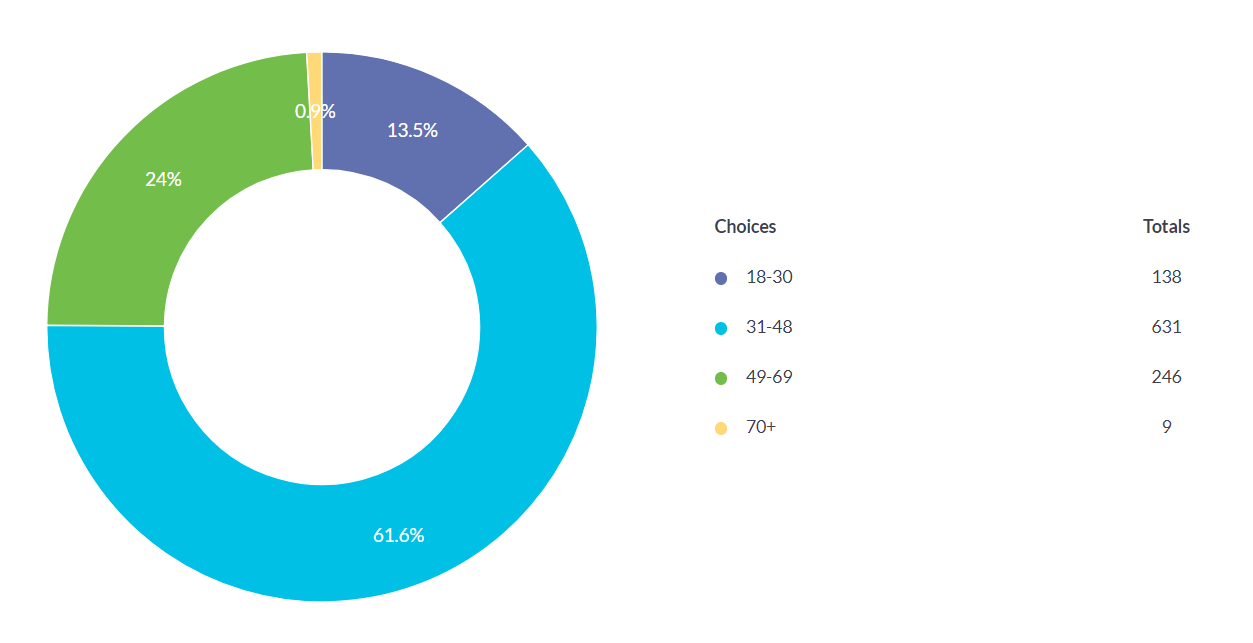
| Age | 2017 statistics | 2018 statistics |
|---|---|---|
| 18-30 | 14.8% | 13.5% |
| 31-48 | 60.3% | 61.6% |
| 49-69 | 24.4% | 24% |
| 70+ | 0.5% | 0.9% |
Q17 Do you work remotely or on site?
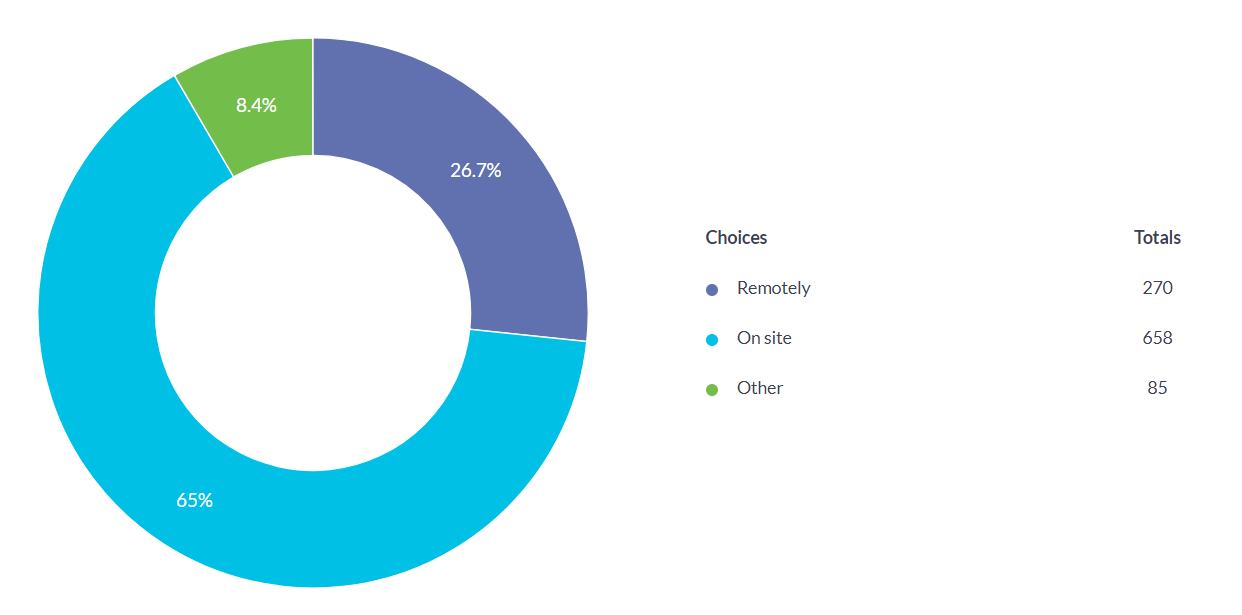
| Choice | 2017 statistics | 2018 statistics |
|---|---|---|
| On site | 66.7% | 65% |
| Remotely | 21.5% | 26.7% |
| Other | 11.8% | 8.4% |
Compared to last year we have a 5% gain on the working remotely option. In the other section the responses were mostly a combination of both.
1013 respondents answered this question.
Q18 What’s your pay bracket?
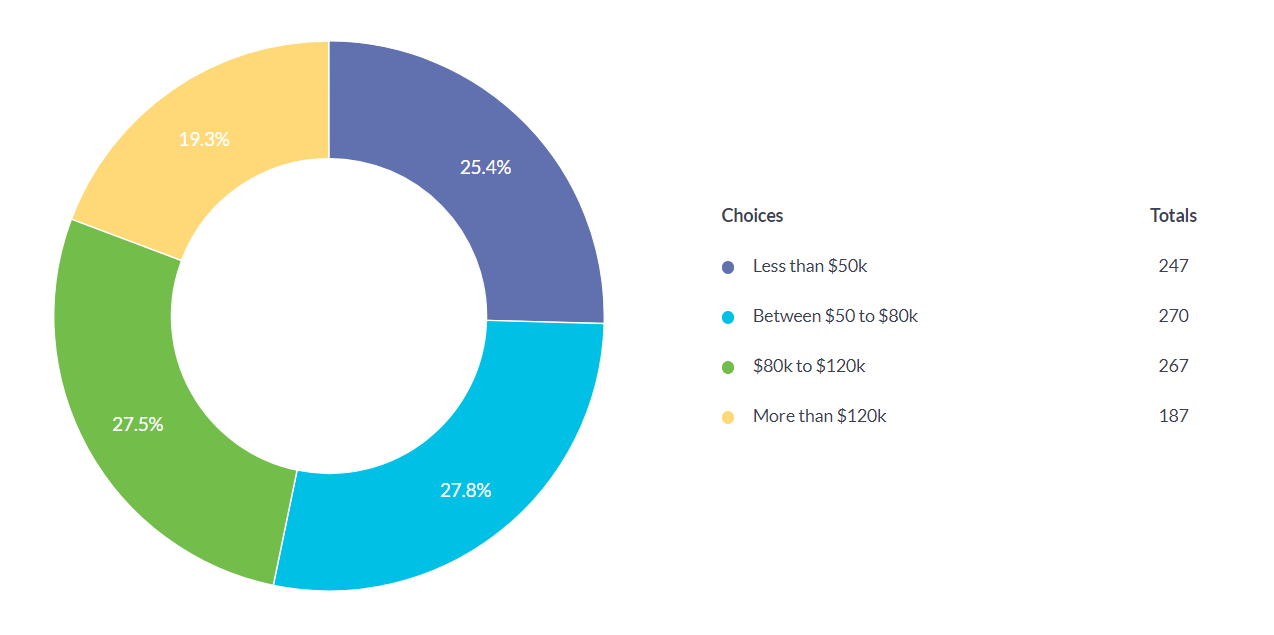
| Pay bracket | 2017 | 2018 |
|---|---|---|
| Less than $50k | 25.9% | 25.4% |
| $50k to $80k | 27.9% | 27.8% |
| $80k to $120k | 27.9% | 27.5% |
| More than $120k | 18.3% | 19.3% |
In the less than $50k bracket there are respondents from all over the world, the countries that stand out are: Russia, 11%, Brazil 10%, Japan 8%, United States 7.6%, United Kingdom, 7.5%.
17% of respondents in the $50k to $80k are from the United Kingdom, 12% from the United States, 9.6% from Japan, 8.8% from Germany, 5.1% from France, 4.8% from the Netherlands and 4% from Brazil and Australia.
The $80k to $120k bracket is lead by the United States with an astounding 46%, followed by the United Kingdom and Germany, each with 7.8%, Japan with 5.2%, Canada with 4.8%, Australia with 4.1% and the Netherlands with 3.3 %.
The more than $120k bracket is gain lead by the United States with 64%, followed by Canada with 6.4%, Australia 5.8%, Germany 2.6%, Netherlands and Denmark, 2.1% each.
Not all countries are presented for each bracket, only those with a significant percentage.
971 respondents answered this question
Q19 Are you a full stack developer?
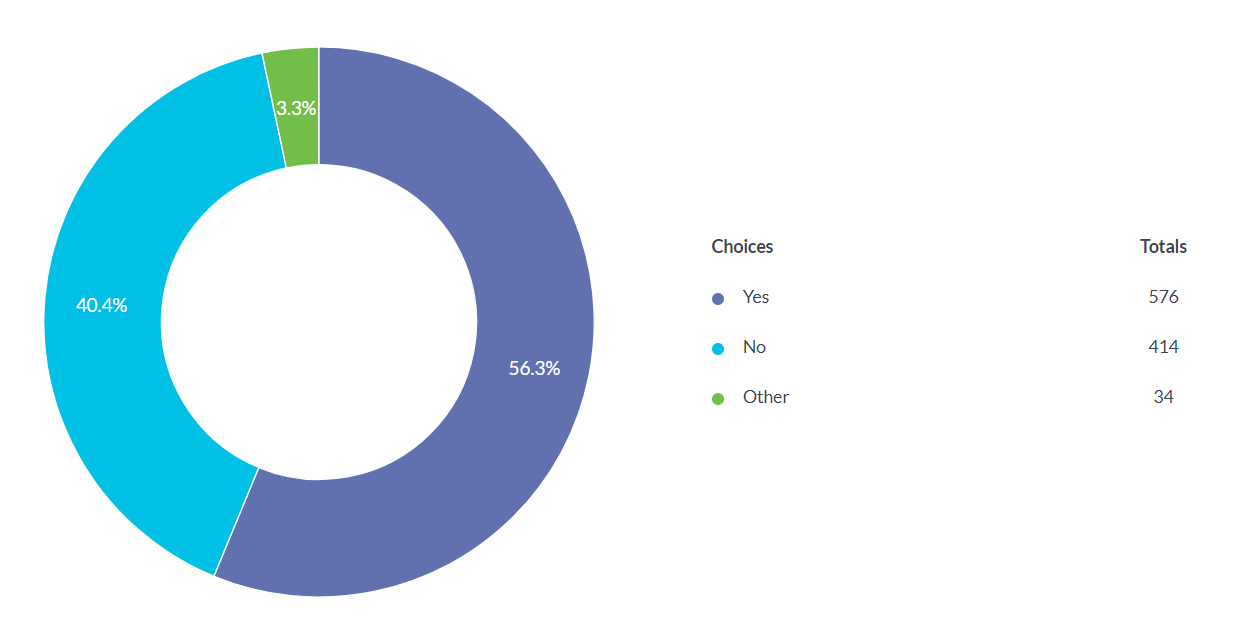
| Answer | 2017 | 2018 |
|---|---|---|
| Yes | 56.6% | 56.3% |
| No | 34.8% | 40.4% |
| Other | 8.6% | 3.3% |
In the other section we received various responses that questioned the nature of the concept of fullstack and various other types of titles.
Q20 Are you a programmer or a sysadmin?
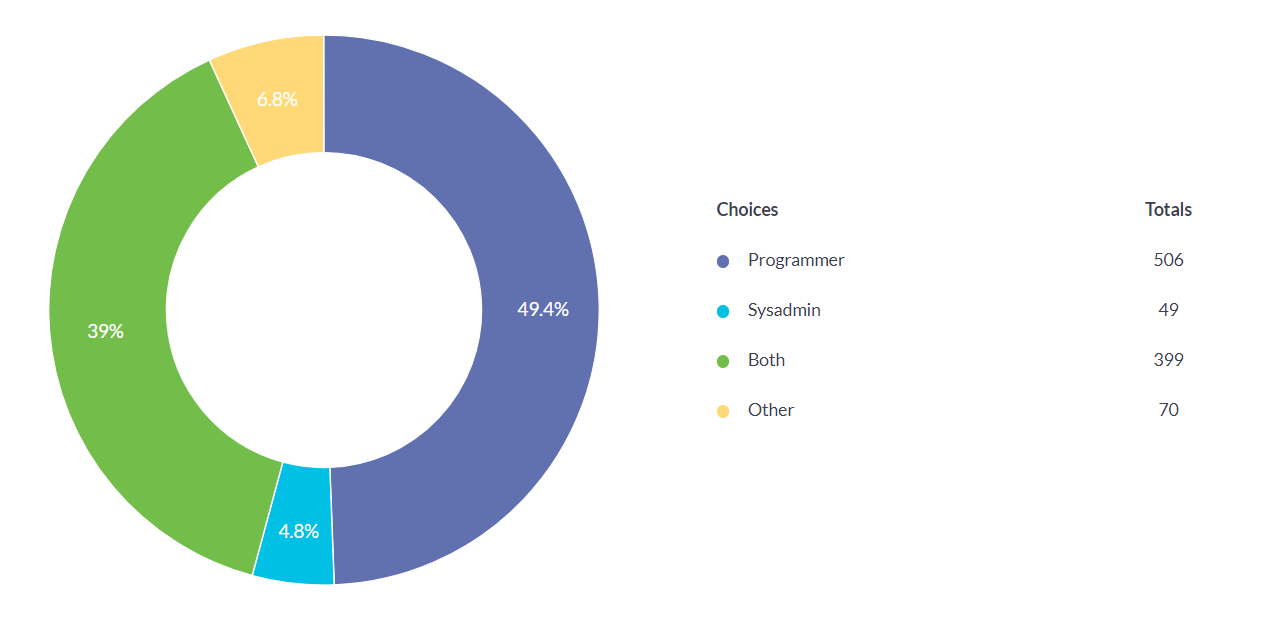
| Answer | 2018 |
|---|---|
| Programmer | 49.4% |
| Sysadmin | 4.8% |
| Both | 39% |
| Other | 6.8% |
Most respondents are programmers, and a considerable amount are programmers and sysadmins, or have similar skills and responsibilities. In the other section we received responses that represent other positions like: architect, engineering or dev ops manager, QA etc.
Q21 What text editor/IDE do you use?
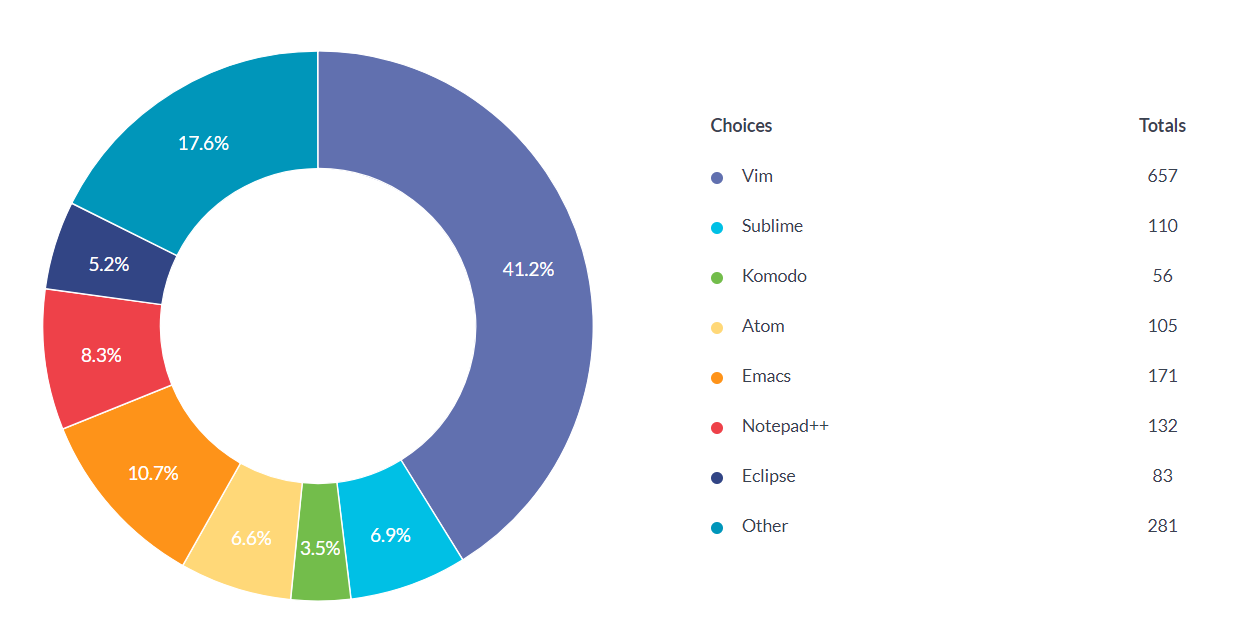
| Text editor/IDE | 2017 statistics | 2018 statistics |
|---|---|---|
| Vim | 47.1% | 41.2% |
| Emacs | 16.2% | 10.7% |
| Notepad++ | 5.3% | 8.3% |
| Sublime | 7.7% | 6.9% |
| Atom | 7.1% | 6.6% |
| Eclipse | 4.3% | 5.2% |
| Komodo | 5.9% | 3.5% |
| Visual Studio | 2.1% | 3.1 % (from other section) |
In the other section we received a variety of responses that didn’t quantify to anything significant.
This was a multiple choice question.
Q22 Have you ever followed a TDD approach to development?
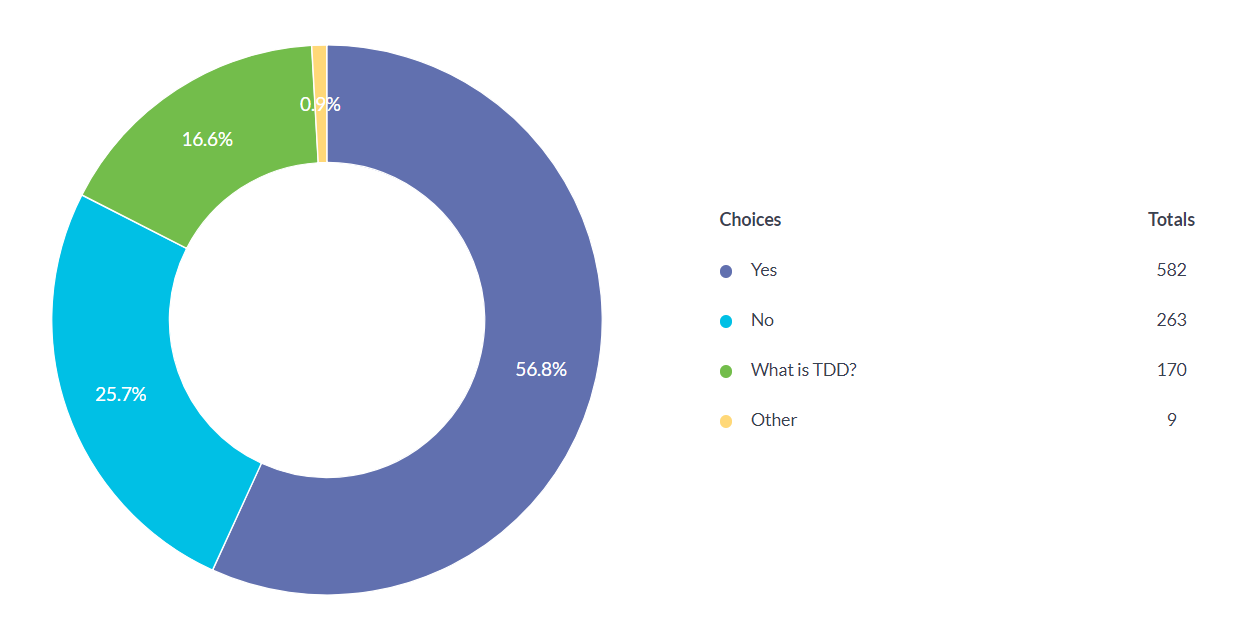
| Answer | 2017 statistics | 2018 statistics |
|---|---|---|
| Yes | 58.4% | 56.8% |
| No | 26.9% | 25.7% |
| What is TDD? | 11% | 16.6% |
| Other | 3.6% | 0.9% |
Q23 What Perl framework do you use?
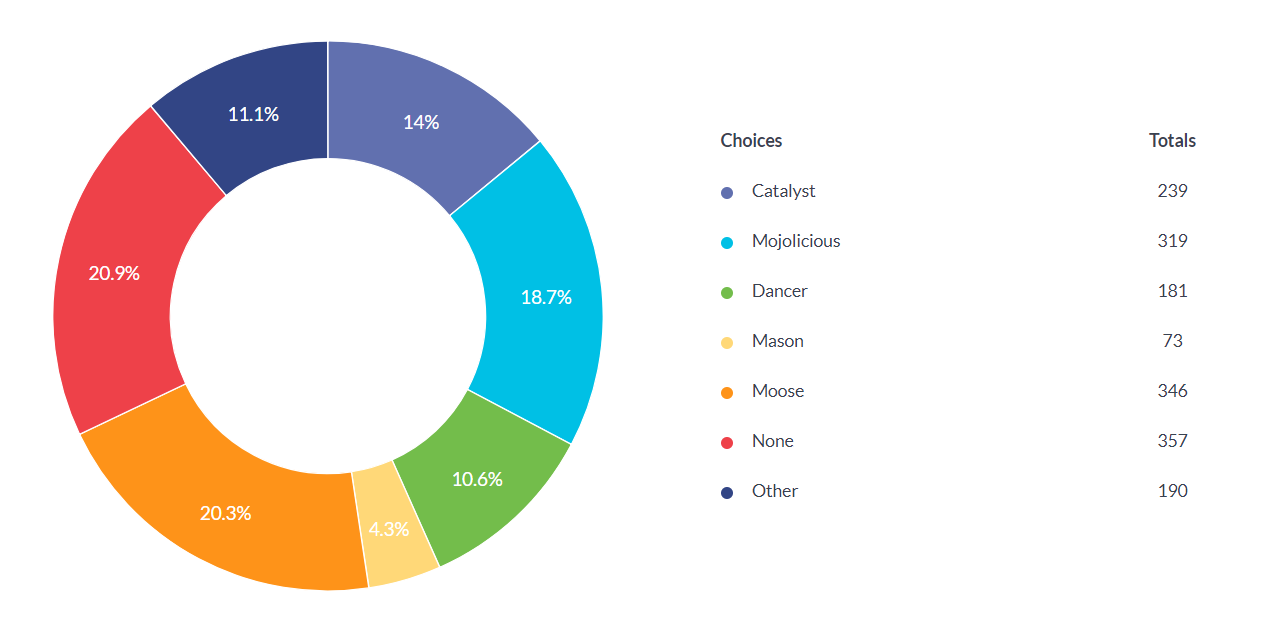
| Answer | 2017 statistics | 2018 statistics |
|---|---|---|
| None | 11.6% | 20.9% |
| Moose | 0.9% | 20.3% |
| Mojolicious | 24.8% | 18.7% |
| Catalyst | 19.1% | 14% |
| Dancer | 19.2% | 10.6% |
| Moo | - | 4.7% |
| Ark | - | 1.9% |
| Amon2 | - | 1.7% |
| CGI | 2% | - |
In 2017 there were more write in responses in the other section that offered a very wide variety of framework choices or answers that did not add to anything significant statistically speaking. In 2018 in the other section there were mentions of Plack, Kelp and home grown solutions.
Q24 What do you use for debugging?
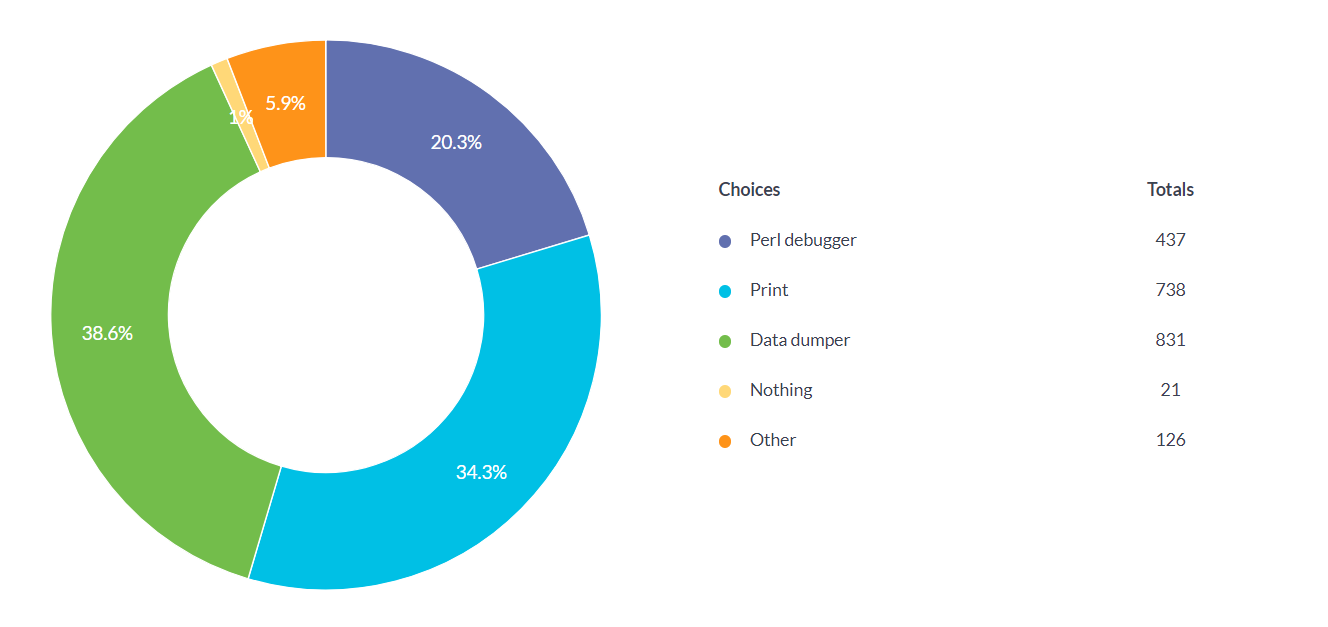
| Answer | 2017 | 2018 |
|---|---|---|
| Data dumper | 6% | 38.6% |
| 18% | 34.3% | |
| Perl debugger | 33% | 20.3% |
| Data::Printer | 1.7% | 2.1% (from other section) |
| Nothing | 2.4% | 1% |
| Komodo | 2.8% | 0.3% (from other section) |
In the 2017 the option was write in so the answers varied, people using a combination of technologies. Overall data dumper is a lot more popular, together with print and Perl debugger.
Q25 What do you use for caching?
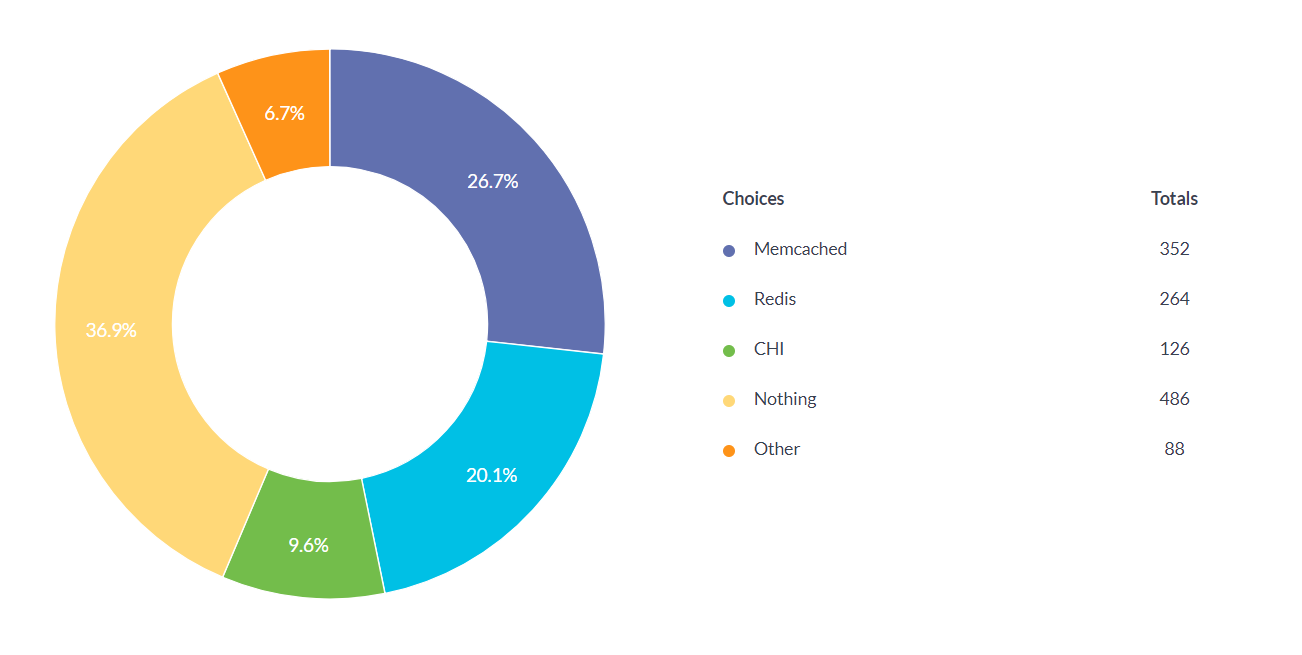
| Answer | 2017 statistics | 2018 statistics |
|---|---|---|
| Nothing | 15.5% | 36.9% |
| Memcached | 22% | 26.7% |
| Redis | 14.7% | 20.1% |
| CHI | 8.8% | 9.6% |
| Varnish | 2.4% | 0.3% (from other section) |
Last year the most popular choice was memcached, this year it was nothing. The rest of the answers in 2017, as in 2018, varied, from homegrown solutions to Apache2 or squid.
Q26 What databases do you use?
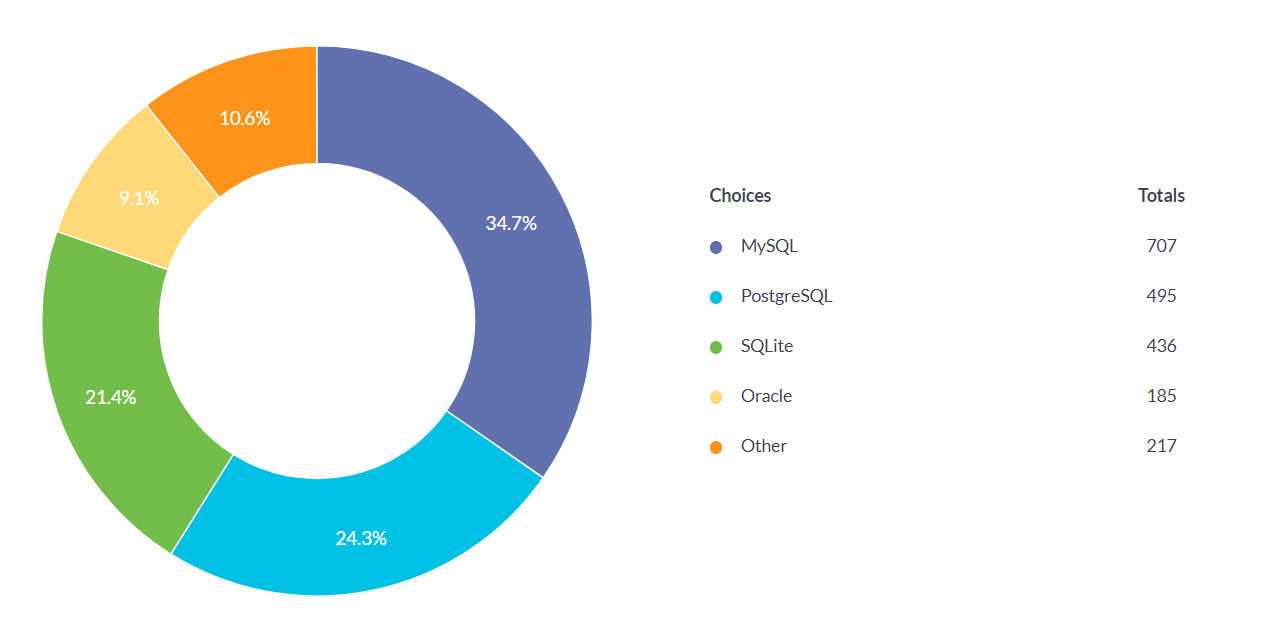
| Answer | 2017 | 2018 |
|---|---|---|
| MySQL | 44% | 34.7% |
| PostgresQL | 29% | 24.3% |
| SQLite | 14.5% | 21.4% |
| Oracle | 10.9% | 10.6% |
| Mongo | - | 2.2% (from other section) |
| Sybase | - | 1.5% (from other section) |
| MSSql | - | 1.3% (from other section) |
| MariaDB | - | 1.1% (from other section) |
There were slight changes from last year, a 10% drop for MySQL and a few new and small entries. The rest of the answers in the other section varied.
Q27 Do you comment your code?
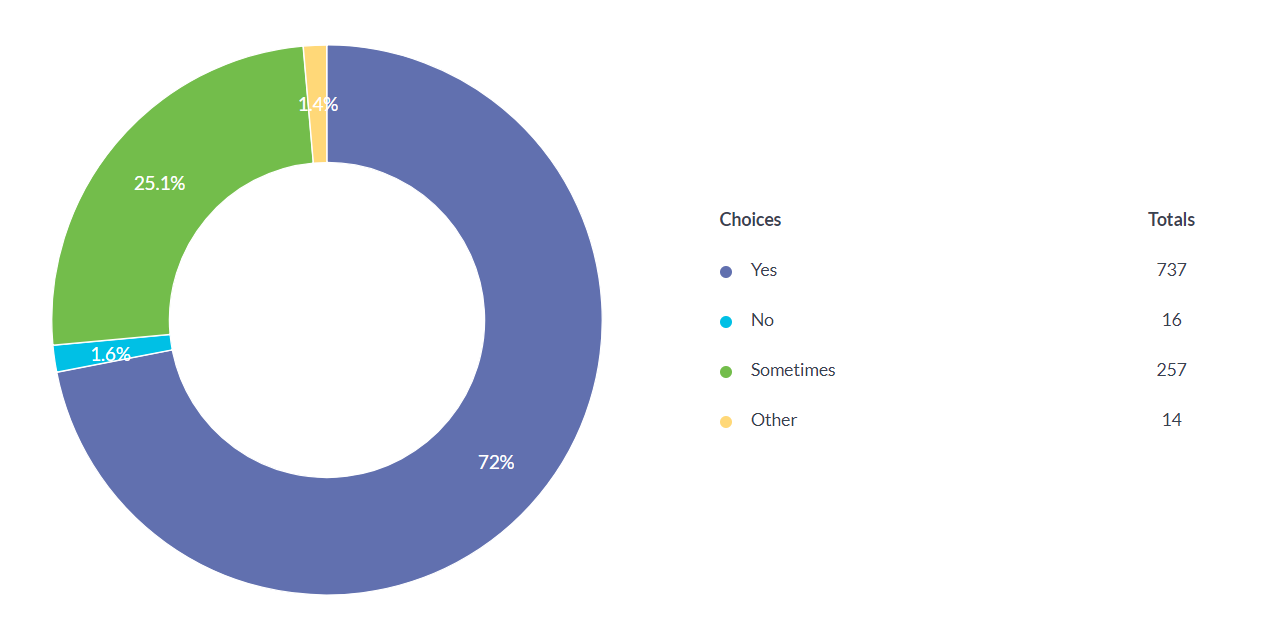
| Answer | 2017 | 2018 |
|---|---|---|
| Yes | 73.1% | 72% |
| No | 2% | 1.6% |
| Sometimes | 21.8% | 25.1% |
In the other section respondents said they comment code rarely or only if it’s absolutely necessary.
Q28 Do you work on new features or maintenance?
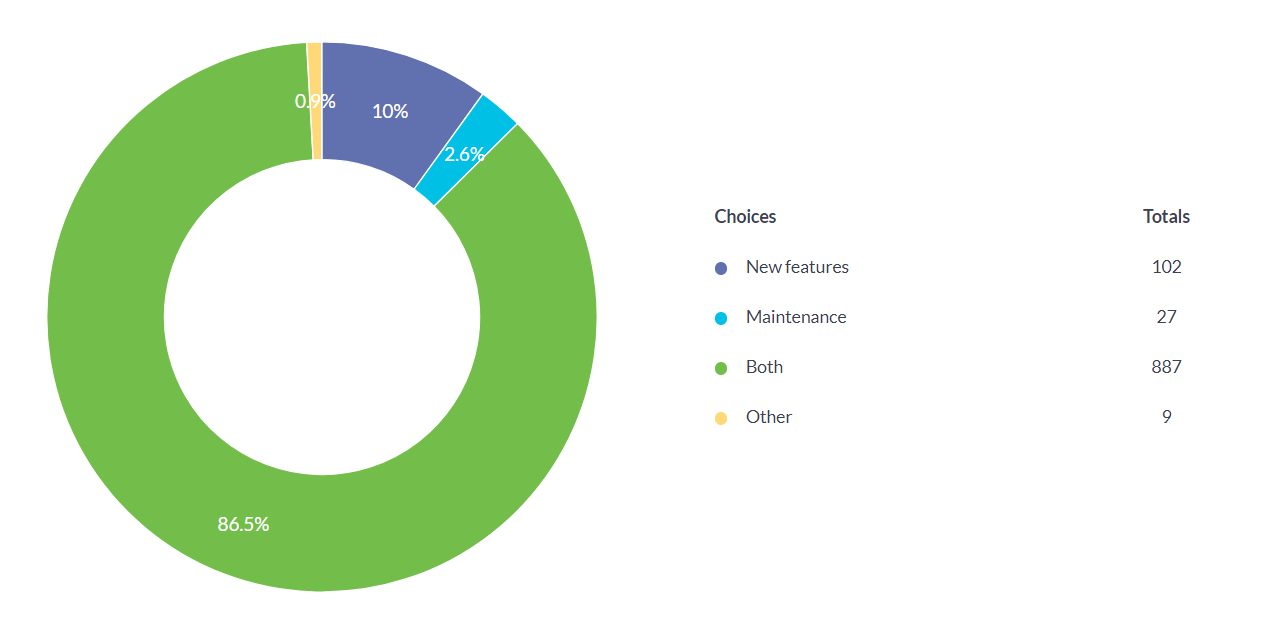
| Answer | 2017 | 2018 |
| New features | 8.2% | 10% |
| Maintenance | 2.2% | 2.6% |
| Both | 88% | 86.5% |
| Other | 1.5% | 0.9% |
Q29 What kind of apps do you work on?
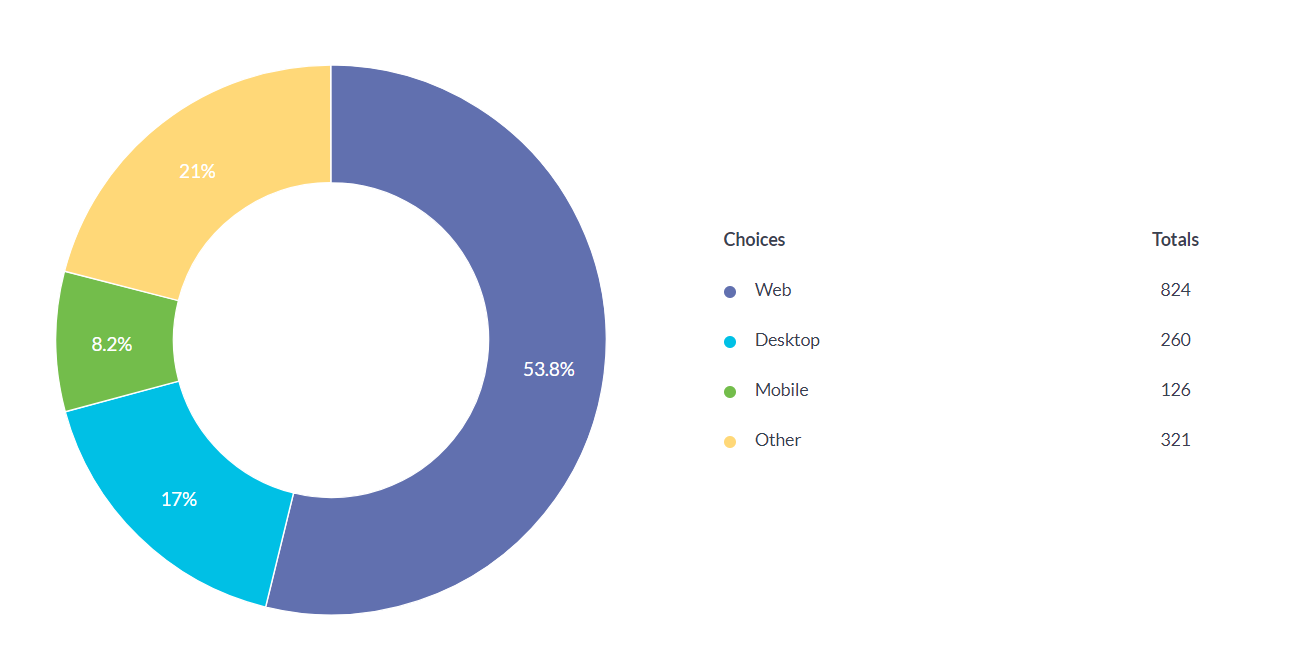
| Answer | 2017 | 2018 |
|---|---|---|
| Web | 51.2% | 53.8% |
| Desktop | 15.8% | 17% |
| Mobile | 7.3% | 8.2% |
| Command Line | - | 2.8% |
| Automation | - | 2.8% |
Web leads the pack once again, followed by desktop and mobile. In the other section there were answers related to data processing, embedded and sysadmin roles.
83% of developers that use Perl 5 as a main languages work on web apps, 24% work on desktop and 10.4% work on mobile.
This was a multiple choice question.
Q30 Do you attend Perl conferences?
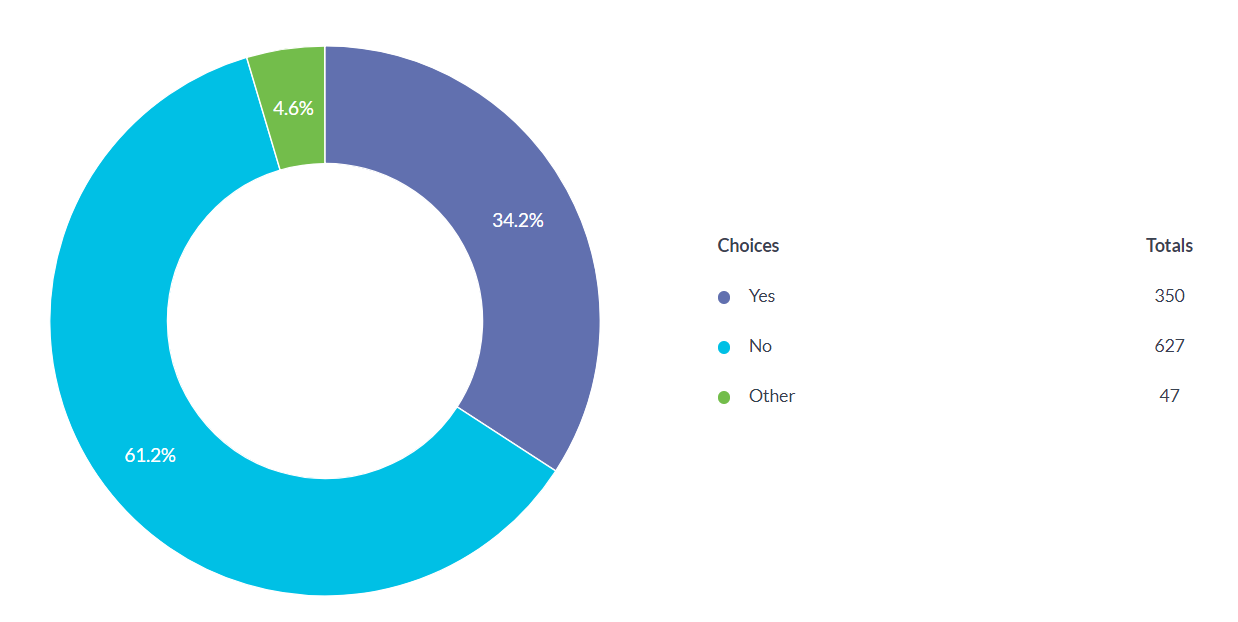
| Answer | 2017 | 2018 |
|---|---|---|
| Yes | 36.4% | 34.2% |
| No | 52.8% | 61.2% |
| Other | 10.7% | 4.6% |
The other section, just like last year, was mostly filled with answer like: used to, nothing nearby, sort of etc.
Respondents that attend Perl conference are from the United States 26.2%, United Kingdom 12.2%, Japan 12%, Germany 7.4%, Russia 5.1%, Netherlands 4%, Brazil 3.7%, Spain and Canada 2.5% each, Italy and Austria 2.2% each.
Q31 Are you part of a Perl Mongers group?
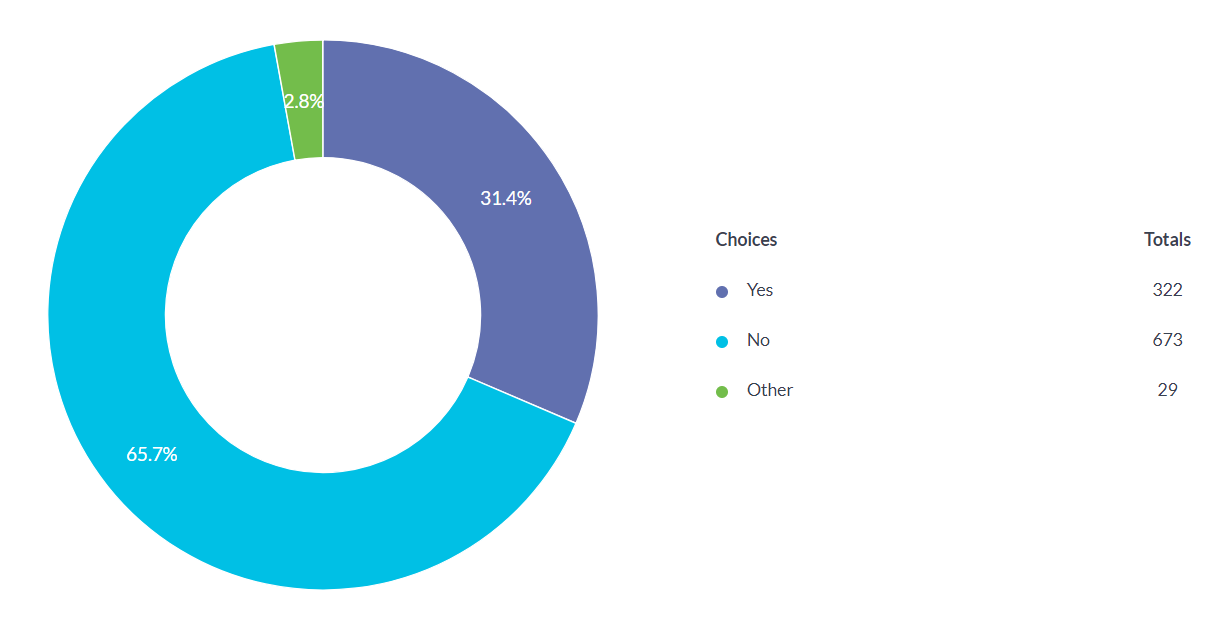
| Answer | 2017 | 2018 |
|---|---|---|
| Yes | 35.4% | 31.4% |
| No | 58.6% | 65.7% |
| Other | 5.6% | 2.8 % |
The other section brought answers like: used to, none nearby, mailing list only.
Q32 What do you think about the Perl community?
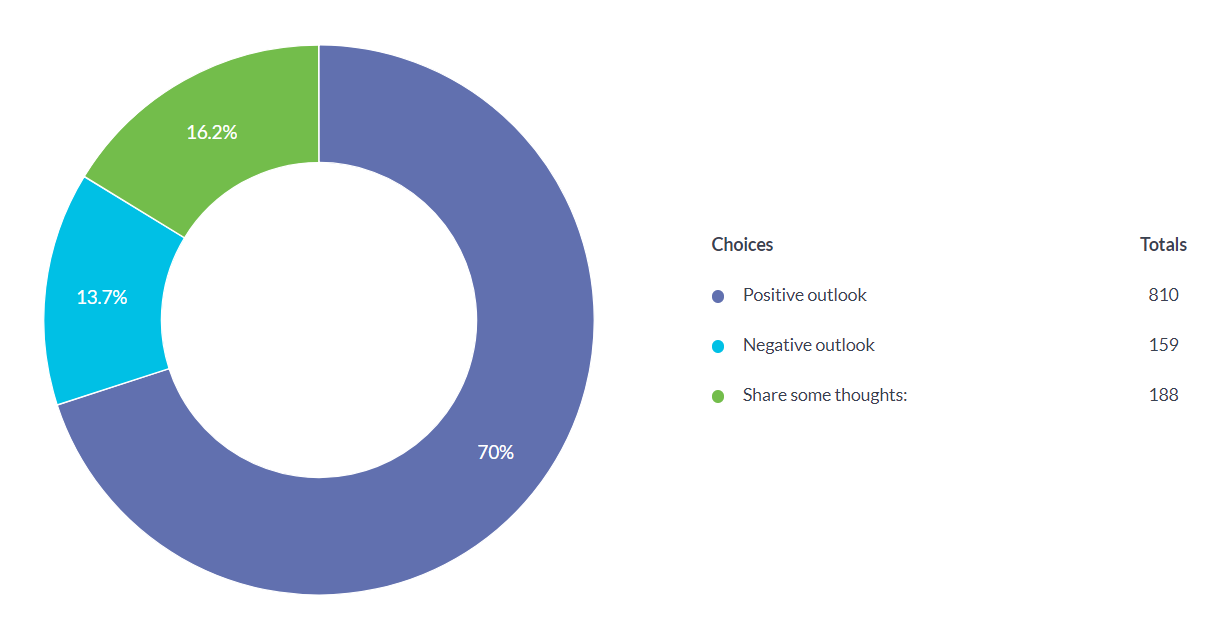
Most respondents have a positive outlook on the Perl community. In the share some thoughts section we received quite a few (negative) responses related to the naming of Perl 6, some on improving Perl 5 more, insular behavior or unwelcoming, issues with CPAN library or neutral or no opinion.
Q33 Do you contribute to open source?
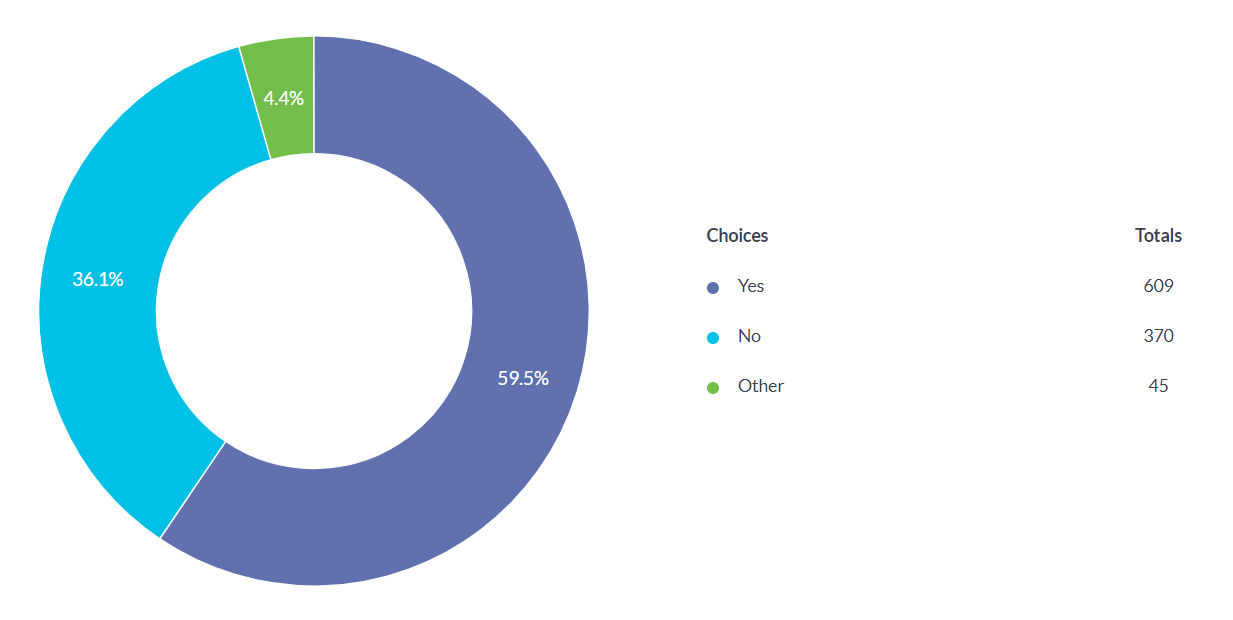
| Answer | 2017 | 2018 |
|---|---|---|
| Yes | 32.1% | 36.1% |
| No | 62.2% | 59.5% |
| Other | 5.8% | 4.4% |
The other section, just like last year, covers respondents that don’t commit to open source regularly or wish to do it in the future.
Q34 Do you blog about your projects/experiences?
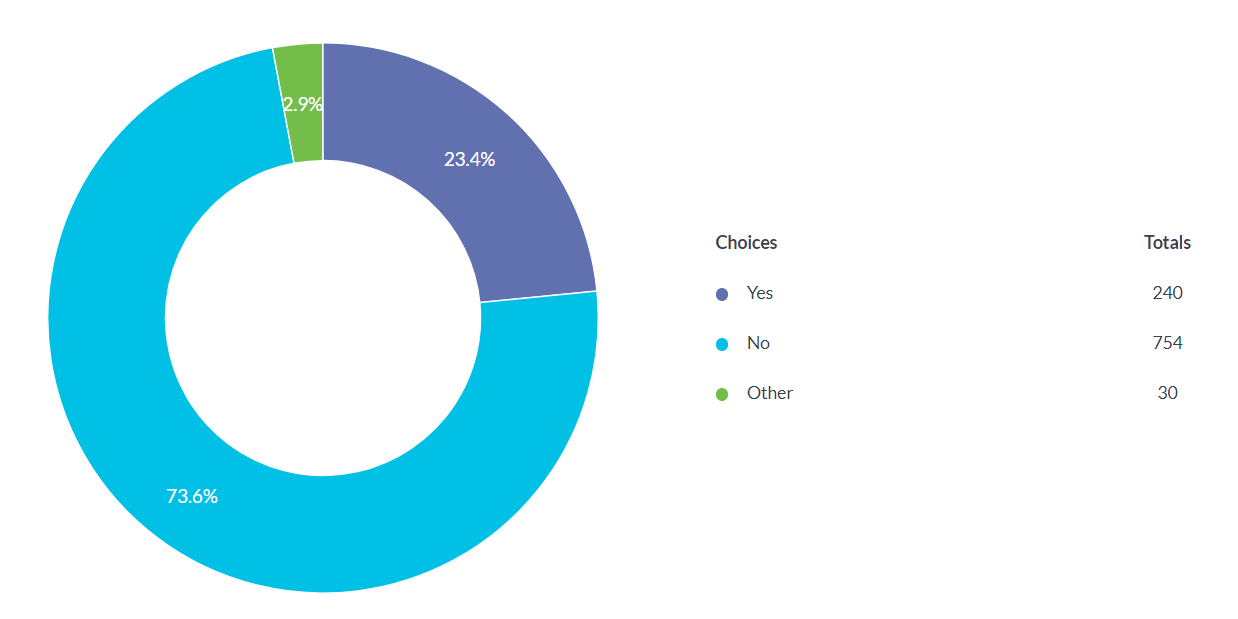
| Answer | 2017 | 2018 |
|---|---|---|
| Yes | 21.3% | 23.4% |
| No | 72.1% | 73.6% |
| Other | 6.6% | 2.9% |
The other sections mostly covers people who don’t blog frequently.
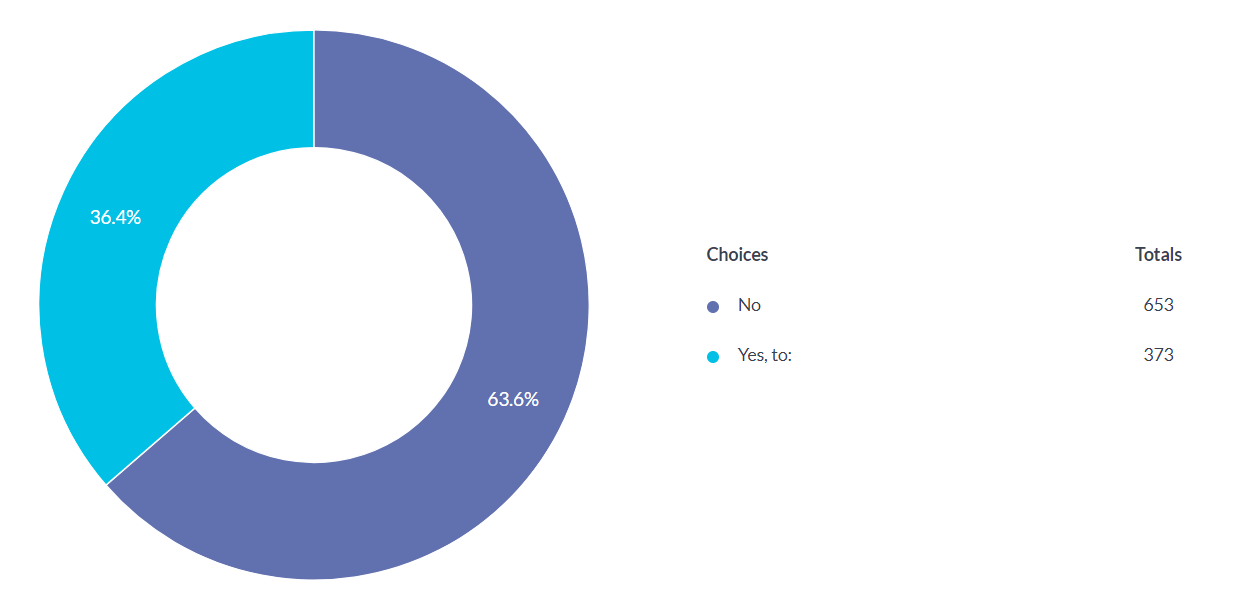
Q35 Do you plan to move from Perl to another language in the future?
| Answer | 2017 | 2018 |
|---|---|---|
| No | 69.4% | 63.6% |
| Yes, to | 30.6% | 36.4% |
| Language breakdown | ||
| Python | 36.8% | 33% |
| Go | 9.6% | 19.5% |
| JavaScript | 4.1% | 5.6% |
| Java | 11.7% | 5% |
| Rust | 2.7% | 3.4% |
| Perl 6 | 8.6% | 3.4% |
| Node.js | 4.8% | 3.2% |
| Scala | 4.8% | 2.9% |
| Ruby | 3.1% | 2.6% |
| Whatever works/pays | 5.1% | 1.5% |
| Elixir | 2% | 0.8% |
Some responses also mentioned using these languages together with Perl, for different projects or for work/personal projects.
79.5% (81.4% last year) of respondents who consider moving from Perl have more than 5 years of experience, 7.9% (8.9% last year) between 3 to 5 years of experience, 8.5% (5.4% last year) between 1 to 3 years and 3.9% (same as last year last year) less than one year of experience.
26.9% of respondents who consider moving from Perl earn less than $50k, 32.6% earn between $50k to $80k, 22.4% are in the $80k to $120k bracket and 17.8% earn more than $120k .
If you’d like to give some feedback on this year’s survey and let us know what type of questions or information you’d like for next year, please fill out this form.
Tags
Samuel Andras
Samuel is a marketing and business development consultant for BuiltinPerl and the Perl division at Evozon. He has written several articles on Perl and was also a volunteer at YAPC::EU 2016.
Browse their articles
Feedback
Something wrong with this article? Help us out by opening an issue or pull request on GitHub
