Building a 3D Engine in Perl, Part 4
This article is the fourth in a series aimed at building a full 3D engine in Perl. The first article started with basic program structure and worked up to displaying a simple depth-buffered scene in an OpenGL window. The second article followed with a discussion of time, view animation, SDL events, keyboard handling, and a nice chunk of refactoring. The third article continued with screenshots, movement of the viewpoint, simple OpenGL lighting, and subdivided box faces.
At the end of the last article, the engine was quite slow. This article shows how to locate the performance problem and what to do about it. Then it demonstrates how to apply the same new OpenGL technique a different way to create an on-screen frame rate counter. As usual, you can follow along with the code by downloading the sample code.
SDL_perl Developments
First, there is some good news–Win32 users are no longer left out in the cold. Thanks to Wayne Keenan, SDL_perl 1.x now fully supports OpenGL on Win32, and prebuilt binaries are available. There are more details at the new SDL_perl 1.x page on my site; browse the Subversion repository at svn.openfoundry.org/sdlperl1.
If you’d like to help in the efforts to improve SDL_perl 1.x, please come visit the SDL_perl 1.x page, check out the code and send me comments or patches, or ping me in #sdlperl on irc.freenode.net.
Benchmarking the Engine
As I mentioned in the introduction, when last I left off, the engine pretty much crawled. It’s time to figure out why and figure out what to do about it. The right tool for the first job is a profiler, which watches a running program and keeps track of the performance of each part of it. Perl’s native profiler is dprofpp, which tracks time spent and call count for every subroutine in the program. Examining these numbers will reveal if the engine spends most of its time in one routine, which will then be the focus for optimization.
It’s best if these numbers are relatively repeatable from run to run, making it easy to compare profiles before and after a change. For a rendering engine, the easiest solution is a benchmark mode. In benchmark mode, the engine runs for a set period of time or number of frames, displaying a predefined scene or sequence. I chose to enable benchmark mode with a new setting in init_conf:
benchmark => 1,
The engine already displays a constant scene as long as the user doesn’t press any keys; the remaining requirement is to quit after a set period.
In previous articles I’ve simply hardcoded an out-of-time check into the rendering loop, but this time I opted for a more general approach, using triggered events. Engine events so far have always come from SDL in response to external input, such as key presses and window close events. In contrast, the engine itself produces triggered events in response to changes in the state of the simulated world, such as a player attempting to open a door or attack an enemy.
To gather these events, I added two new lines to the beginning of do_events; the opening lines are now:
sub do_events
{
    my $self = shift;

    my $queue     = $self->process_events;
    my $triggered = $self->triggered_events;
    push @$queue, @$triggered;
After processing the SDL events with process_events and stuffing the resulting commands into the $queue, do_events calls triggered_events to gather commands from any pending internally generated events and adds them to the $queue. triggered_events can be pretty simple for now:
sub triggered_events
{
    my $self = shift;

    my @queue;
    push @queue, 'quit' if $self->{conf}{benchmark} and
                           $self->{world}{time} >= 5;
    return \@queue;
}
This is pretty much a direct translation of the old hardcoded timeout code to the command queue concept. Normally triggered_events simply returns an empty arrayref, indicating no events were triggered, and therefore no commands generated. Benchmark mode adds a quit command to the queue as soon as the world time reaches 5 seconds. Normal command processing in do_events will take care of the rest.
dprofpp is Your (Obtuse) Friend
With benchmark mode enabled, the engine runs under dprofpp. The first step is to collect the profile data:
dprofpp -Q -p step065
-p step065 tells dprofpp to profile the program named step065, and -Q tells it to quit after collecting the data. dprofpp ran step065, collected the profile data, and stored it in a specially formatted text file named tmon.out in the current directory.
To turn the profile data into human-readable output, I used dprofpp without any arguments. It crunched the collected data for a while and finally produced this:
$ dprofpp
Exporter::Heavy::heavy_export_to_level has 4 unstacked calls in outer
Exporter::export_to_level has -4 unstacked calls in outer
Exporter::export has -12 unstacked calls in outer
Exporter::Heavy::heavy_export has 12 unstacked calls in outer
Total Elapsed Time = 4.838377 Seconds
  User+System Time = 1.498377 Seconds
Exclusive Times
%Time ExclSec CumulS #Calls sec/call Csec/c  Name
 88.1   1.320  1.320      1   1.3200 1.3200  SDL::SetVideoMode
 38.1   0.571  0.774    294   0.0019 0.0026  main::draw_quad_face
 16.0   0.240  0.341      8   0.0300 0.0426  SDL::OpenGL::BEGIN
 13.0   0.195  0.195  64722   0.0000 0.0000  SDL::OpenGL::Vertex
 11.3   0.170  0.170      1   0.1700 0.1700  DynaLoader::dl_load_file
 9.34   0.140  0.020     12   0.0116 0.0017  Exporter::export
 6.67   0.100  0.100   1001   0.0001 0.0001  SDL::in
 4.00   0.060  0.060      1   0.0600 0.0600  SDL::Init
 3.34   0.050  0.847      8   0.0062 0.1059  main::BEGIN
 2.00   0.030  0.040      5   0.0060 0.0080  SDL::Event::BEGIN
 1.80   0.027  0.801     49   0.0005 0.0163  main::draw_cube
 1.47   0.022  0.022   2947   0.0000 0.0000  SDL::OpenGL::End
 1.33   0.020  0.020      1   0.0200 0.0200  warnings::BEGIN
 1.33   0.020  0.020     16   0.0012 0.0012  Exporter::as_heavy
 1.33   0.020  0.209      5   0.0040 0.0418  SDL::BEGIN
There are several problems with this output. The numbers are clearly silly (88 percent of its time spent in SDL::SetVideoMode?), the statistics for the various BEGIN blocks are inconsequential to the task and in the way, and the error messages at the top are rather disconcerting. To fix these issues, dprofpp has the -g option, which tells dprofpp to only display statistics for a particular routine and its descendants:
$ dprofpp -g main::main_loop
Total Elapsed Time = 4.952042 Seconds
  User+System Time = 0.812051 Seconds
Exclusive Times
%Time ExclSec CumulS #Calls sec/call Csec/c  Name
 70.3   0.571  0.774    294   0.0019 0.0026  main::draw_quad_face
 24.0   0.195  0.195  64722   0.0000 0.0000  SDL::OpenGL::Vertex
 3.32   0.027  0.801     49   0.0005 0.0163  main::draw_cube
 2.71   0.022  0.022   2947   0.0000 0.0000  SDL::OpenGL::End
 1.23   0.010  0.010     49   0.0002 0.0002  SDL::OpenGL::Rotate
 1.11   0.009  0.009      7   0.0013 0.0013  main::prep_frame
 1.11   0.009  0.009     70   0.0001 0.0001  SDL::OpenGL::Color
 0.25   0.002  0.002   2947   0.0000 0.0000  SDL::OpenGL::Begin
 0.00       - -0.000      1        -      -  main::action_quit
 0.00       - -0.000      2        -      -  SDL::EventType
 0.00       - -0.000      2        -      -  SDL::Event::type
 0.00       - -0.000      7        -      -  SDL::GetTicks
 0.00       - -0.000      7        -      -  SDL::OpenGL::Clear
 0.00       - -0.000      7        -      -  SDL::OpenGL::GL_NORMALIZE
 0.00       - -0.000      7        -      -  SDL::OpenGL::GL_SPOT_EXPONENT
You may have noticed that I specified main::main_loop instead of just main_loop. dprofpp always uses fully qualified names and will give empty results if you use main_loop without the main:: package qualifier.
In this exclusive times view, the percentages in the first column and the row order depend only on the runtime of each routine, without respect to its children. Using just this view, I might have tried to optimize draw_quad_face somehow, as it appears to be the most expensive routine by a large margin. That’s not the best approach, however, as an inclusive view (-I) shows:
$ dprofpp -I -g main::main_loop
Total Elapsed Time = 4.952042 Seconds
  User+System Time = 0.812051 Seconds
Inclusive Times
%Time ExclSec CumulS #Calls sec/call Csec/c  Name
 100.       -  0.814      7        - 0.1163  main::do_frame
 99.9       -  0.812      1        - 0.8121  main::main_loop
 99.7       -  0.810      7        - 0.1158  main::draw_view
 99.2       -  0.806      7        - 0.1151  main::draw_frame
 98.6   0.027  0.801     49   0.0005 0.0163  main::draw_cube
 95.3   0.571  0.774    294   0.0019 0.0026  main::draw_quad_face
 24.0   0.195  0.195  64722   0.0000 0.0000  SDL::OpenGL::Vertex
 2.71   0.022  0.022   2947   0.0000 0.0000  SDL::OpenGL::End
 1.23   0.010  0.010     49   0.0002 0.0002  SDL::OpenGL::Rotate
 1.11   0.009  0.009     70   0.0001 0.0001  SDL::OpenGL::Color
 1.11   0.009  0.009      7   0.0013 0.0013  main::prep_frame
 0.25   0.002  0.002   2947   0.0000 0.0000  SDL::OpenGL::Begin
 0.00       - -0.000      1        -      -  main::action_quit
 0.00       - -0.000      2        -      -  SDL::EventType
 0.00       - -0.000      2        -      -  SDL::Event::type
In this view, draw_quad_face looks even worse, because the first column now includes the time taken by all of the OpenGL calls inside of it, including tens of thousands of glVertex calls. It seems that I should do something to speed it up, but at this point it’s not entirely clear how to simplify it or reduce the number of OpenGL calls it makes (other than reducing the subdivision level of each face, which would reduce rendering quality).
Actually, there’s a better option. The real problem is that draw_cube dominates the execution time, and draw_quad_face dominates that. How about not calling draw_cube (and therefore draw_quad_face) at all during normal rendering? It seems extremely wasteful to have to tell OpenGL how to render a cube face dozens of times each frame. If only there were a way to tell OpenGL to remember the cube definition once, and just refer to that definition each time the engine needs to draw it.
Display Lists
I expect no one will find it surprising that OpenGL provides exactly this function, with the display lists facility. A display list is a list of OpenGL commands to execute to perform some function. The OpenGL driver stores it (sometimes in a mildly optimized format) and further code refers to it by number. Later, the program can request that OpenGL run the commands in some particular list as many times as desired. Lists can even call other lists; a bicycle model might call a wheel display list twice, and the wheel display list might itself call a spoke display list dozens of times.
I added init_models to create display lists for each shape I want to model:
sub init_models
{
    my $self = shift;

    my %models = (
        cube => \&draw_cube,
    );
    my $count  = keys %models;
    my $base   = glGenLists($count);
    my %display_lists;

    foreach my $model (keys %models) {
        glNewList($base, GL_COMPILE);
        $models{$model}->();
        glEndList;

        $display_lists{$model} = $base++;
    }

    $self->{models}{dls} = \%display_lists;
}
%models associates each model with the code needed to draw it. Because the engine already knows how to draw a cube, I simply reused draw_cube here. The next two lines begin the work of building the display lists. The code first determines how many display lists it needs and then calls glGenLists to allocate them. OpenGL numbers the allocated lists in sequence, returning the first number in the sequence (the list base). For example, if the code had requested four lists, OpenGL might have numbered them 1051, 1052, 1053, and 1054, and would then return 1051 as the list base.
For each defined model, init_models calls glNewList to tell OpenGL that it is ready to compile a new display list at the number $base. OpenGL then prepares to convert any subsequent OpenGL calls to entries in the list, rather than rendering them immediately. If I had chosen GL_COMPILE_AND_EXECUTE instead of GL_COMPILE, OpenGL would perform the rendering and save the calls in the display list at the same time. GL_COMPILE_AND_EXECUTE is useful for on-the-fly caching when code needs active rendering anyway. Because init_models is simply precaching the rendering commands and nothing should render while this occurs, GL_COMPILE is the better choice.
The code then calls the drawing routine, which conveniently submits all of the OpenGL calls needed for the new list. The call to glEndList then tells OpenGL to stop recording entries in the display list and return to normal operation. The model loop then records the display list number used by the current model in the %display_lists hash, and increments $base for the next iteration. After processing all of the models, init_models saves %display_lists into a new structure in the engine object.
init calls init_models just before init_objects:
$self->init_models;
$self->init_objects;
With this initialization in place, the next step was to change draw_view to draw from either a model or a draw routine. To do this, I replaced the $o->{draw}->() call with:
    if ($o->{model}) {
        my $dl = $self->{models}{dls}{$o->{model}};
        glCallList($dl);
    }
    else {
        $o->{draw}->();
    }
If the object has an associated model, draw_view looks up the display list in the hash created by init_models, and then calls the list using glCallList. Otherwise, draw_view falls back to calling the object’s draw routine as before. A quick run confirmed that the fallback works and adding init_models didn’t break anything, so it was safe to change init_objects to use models instead of draw routines for the cubes. This involved replacement of just three lines–I changed each copy of:
draw =& \&draw_cube,
to:
model =& 'cube',
Suddenly, the engine was much faster and more responsive. A dprofpp run confirmed this:
$ dprofpp -Q -p step068

Done.
$ dprofpp -I -g main::main_loop
Total Elapsed Time = 4.053240 Seconds
  User+System Time = 0.973250 Seconds
Inclusive Times
%Time ExclSec CumulS #Calls sec/call Csec/c  Name
 99.9       -  0.973      1        - 0.9733  main::main_loop
 86.5   0.024  0.842    413   0.0001 0.0020  main::do_frame
 58.1   0.203  0.566    413   0.0005 0.0014  main::draw_view
 56.9   0.016  0.554    413   0.0000 0.0013  main::draw_frame
 20.1   0.196  0.196    413   0.0005 0.0005  SDL::GLSwapBuffers
 19.3       -  0.188    413        - 0.0005  SDL::App::sync
 18.4       -  0.180    413        - 0.0004  main::end_frame
 16.7   0.163  0.163   2891   0.0001 0.0001  SDL::OpenGL::CallList
 9.14   0.028  0.089    413   0.0001 0.0002  main::do_events
 8.53   0.035  0.083    413   0.0001 0.0002  main::prep_frame
 6.68   0.008  0.065    413   0.0000 0.0002  main::process_events
 5.03   0.049  0.049   3304   0.0000 0.0000  SDL::OpenGL::GL_LIGHTING
 4.93   0.002  0.048    413   0.0000 0.0001  SDL::Event::pump
 4.73   0.046  0.046    413   0.0001 0.0001  SDL::PumpEvents
 4.11   0.012  0.040    413   0.0000 0.0001  main::update_time
Note that I had to run dprofpp -Q -p again with the new code before doing the analysis, or dprofpp would have just reused the old tmon.out.
The first thing to note in this report is that previously the engine only managed seven frames (calls to do_frame) before timing out, but now managed 413 in the same time! Secondly, as intended, main_loop never calls draw_cube, having replaced all such calls with calls to glCallList. Because of this it is no longer necessary to do many thousands of low-level OpenGL calls to draw the scene each frame, with the attendant Perl and XS overhead. Instead, the OpenGL driver handles all of those calls internally, with minimal overhead.
This has the added advantage that it is now feasible to run the engine on one computer and display the window on another, as the OpenGL driver on the displaying computer saves the display lists. Once init_models compiles the display lists, they are loaded into the display driver, and future frames require minimal network traffic to handle glCallList. (Adventurous users running X can do this by logging in locally to the display computer, sshing to the computer that has the engine and SDL_perl on it, and running the program there. If your ssh has X11 forwarding turned on, your reward should be a local window. And there was much rejoicing.)
An FPS Counter
The measurements that dprofpp performs have enough overhead to significantly reduce the engine’s apparent performance. (Even old hardware can do better than 80-100 FPS with this simple scene.) The overhead is necessary to get a detailed analysis, but when it comes time to show off, most users want to have a nice frame rate display showing the performance of the engine running as fast as it can.
Making a frame rate display requires the ability to render text in front of the scene. The necessary pieces of that are:
- A font containing glyphs for the characters to display (at least 0 through 9).
- A font reader to load the font from a file into memory as bitmaps.
- A converter from raw bitmaps to a format that OpenGL can readily display.
- A way to render the proper bitmaps for a given string.
- A way to calculate the current frame rate.
The Numbers Font
There are hundreds of freely available fonts, but most of them are available only in fairly complex font formats such as TrueType and Type 1. Some versions of SDL_perl support these complex font formats, but this support has historically been frustratingly buggy or incomplete.
Given the relatively simple requirement (render a single integer), I chose instead to create a very simple bitmapped font format just for this article. The font file is numbers-7x11.txt in the examples tarball. It begins as follows:
7x11

30
..000..
.0...0.
.0...0.
0.....0
0.....0
0.....0
0.....0
0.....0
.0...0.
.0...0.
..000..

31
...0...
..00...
00.0...
...0...
...0...
...0...
...0...
...0...
...0...
...0...
0000000
The first line indicates the size of each character cell in the font; in this case, seven columns and 11 rows. The remaining chunks each consist of the character’s codepoint in hex followed by a bitmap represented as text–. represents a transparent pixel, and 0 represents a rendered pixel. Empty lines separate chunks.
The Font Reader
To read the glyph definitions into bitmaps, I first added read_font_file:
sub read_font_file
{
    my $self = shift;
    my $file = shift;

    open my $defs, '<', $file
        or die "Could not open '$file': $!";
    local $/ = '';

    my $header  = <$defs>;
    chomp($header);
    my ($w, $h) = split /x/ =& $header;

    my %bitmaps;
    while (my $def = <$defs>) {
        my ($hex, @rows) = grep /\S/ =& split /\n/ =& $def;

        @rows = map {tr/.0/01/; pack 'B*' =& $_} @rows;

        my $bitmap           = join '' =& reverse @rows;
        my $codepoint        = hex $hex;

        $bitmaps{$codepoint} = $bitmap;
    }

    return (\%bitmaps, $w, $h);
}
read_font_file begins by opening the font file for reading. It next requests paragraph slurping mode by setting $/ to ''. In this mode, Perl automatically breaks up the font file at empty lines, with the header first followed by each complete glyph definition as a single chunk. Next, the routine reads the header, chomps it, and splits the cell size definition into width and height.
With the preliminaries out of the way, read_font_file creates a hash to store the finished bitmaps and enters a while loop over the remaining chunks of the font file. Each glyph definition is split into a hex number and an array of bitmap rows; using grep /\S/ =& ignores any trailing blank lines.
The next line converts textual rows to real bitstrings. First, each transparent pixel (.) becomes 0, and each rendered pixel (0) turns into a 1. Feeding the resulting binary text string to pack 'B*' converts the binary into an actual bitstring, with the bits packed in starting from the high bit of each byte (as OpenGL prefers). The resulting bitstrings are stored back in @rows.
Because OpenGL prefers bitmaps to start at the bottom and go up, the code reverses @rows before joining to create the finished bitmap. The hex operator converts the hex number to decimal to be the key for the newly created bitmap in the %bitmaps hash.
After parsing the whole font file, the function returns the bitmaps to the caller, along with the cell size metrics.
Speaking OpenGL’s Language
The bitmaps produced by read_font_file are simply packed bitstrings, in this case 11 bytes long (one byte per seven-pixel row). Before using them to render strings, the engine must first load these bitmaps into OpenGL. This happens in the main init_fonts routine:
sub init_fonts
{
    my $self  = shift;

    my %fonts = (
        numbers =& 'numbers-7x11.txt',
    );

    glPixelStore(GL_UNPACK_ALIGNMENT, 1);

    foreach my $font (keys %fonts) {
        my ($bitmaps, $w, $h) =
            $self->read_font_file($fonts{$font});

        my @cps    = sort {$a <=& $b} keys %$bitmaps;
        my $max_cp = $cps[-1];
        my $base   = glGenLists($max_cp + 1);

        foreach my $codepoint (@cps) {
            glNewList($base + $codepoint, GL_COMPILE);
            glBitmap($w, $h, 0, 0, $w + 2, 0,
                     $bitmaps->{$codepoint});
            glEndList;
        }

        $self->{fonts}{$font}{base} = $base;
    }
}
init_fonts opens with a hash associating each known font with a font file; at the moment, only the numbers font is defined. The real work begins with the glPixelStore call, which tells OpenGL that the rows for all bitmaps are tightly packed (along one-byte boundaries) rather than being padded, so that each row begins at even two-, four-, or eight-byte memory locations.
The main font loop starts by calling read_font_file to load the bitmaps for the current font into memory. The next line sorts the codepoints into @cps, and the following line finds the maximum codepoint by simply taking the last one in @cps.
The glGenLists call allocates display lists for codepoints 0 through $max_cp, which will have numbers from $base through $base + $max_cp. For each codepoint defined by the font, the inner loop uses glNewList to start compiling the appropriate list, glBitmap to load the bitmap into OpenGL, and finally, glEndList to finish compiling the list.
The glBitmap call has six parameters aside from the bitmap data itself ($bitmaps->{$codepoint}). The first two are the width and height of the bitmap in pixels, which read_font_file conveniently provides. The next two define the origin for the bitmap, counted from the lower-left corner. Bitmap fonts use a non-zero origin for several purposes, generally when the glyph extends farther left or below the “normal” lower-left corner. This may be because the glyph has a descender (a part of the glyph that descends below the general line of text, as with the lowercase letters “p” and “y”), or perhaps because the font leans to the left. The simple code in init_fonts assumes none of these special cases apply and sets the origin to (0,0).
The last two parameters are the X and Y increments, the distances that OpenGL should move along the X and Y axes before drawing the next character. Left-to-right languages use fonts with positive X and zero Y increments; right-to-left languages use negative X and zero Y. Top-to-bottom languages use zero X and negative Y. The increments must include both the width/height of the character itself and any additional distance needed to provide proper spacing. In this case, the rendering will be left to right. I wanted two extra pixels for spacing, so I set the X increment to width plus two, and the Y increment to zero.
The last line of the outer loop simply saves the list base for the font to make it available later during rendering.
init calls init_fonts as usual, just after the call to init_time:
$self->init_fonts;
Text Rendering
The hard part is now done: parsing the font file and loading the bitmaps into OpenGL. The new draw_fps routine calculates and renders the frame rate:
sub draw_fps
{
    my $self   = shift;

    my $base   = $self->{fonts}{numbers}{base};
    my $d_time = $self->{world}{d_time} || 0.001;
    my $fps    = int(1 / $d_time);

    glColor(1, 1, 1);
    glRasterPos(10, 10, 0);
    glListBase($base);
    glCallListsScalar($fps);
}
The routine starts by retrieving the list base for the numbers font, retrieving the world time delta for this frame, and calculating the current frames per second as one frame in $d_time seconds. It takes a little care to make sure $d_time is non-zero, even if the engine is running so fast that it renders a frame in less than a millisecond (the precision of SDL time handling); otherwise, the $fps calculation would die with a divide-by-zero error.
The OpenGL section begins by setting the current drawing color to white with a call to glColor. The next line sets the raster position, the window coordinates at which to place the origin of the next bitmap. After rendering each bitmap, the raster position is automatically updated using the bitmap’s X and Y increments so that the bitmaps will not overlap each other. In this case, (10, 10, 0) sets the raster position ten pixels up and right from the lower-left corner of the window, with Z=0.
The next two lines together actually call the appropriate display list in our bitmap font for each character in the $fps string. glCallListsScalar breaks the string into individual characters and calls the display list with the same number as the codepoint of the character. For example, for the “5” character (at codepoint 53 decimal), glCallListsScalar calls display list 53. Unfortunately, there’s no guarantee that display list 53 actually will display a “5,” because the font’s list base may not be 0. If the font had a list base of 1500, for example, the code would need to call display list 1500+53=1553 to display the “5.”
Rather than make the programmer do this calculation manually every time, OpenGL provides the glListBase function, which sets the list base to use with glCallLists. After the glListBase call above, OpenGL will automatically offset every display list number specified with glCallLists by $base.
You may have noticed that in the code I use glCallListsScalar, but the previous paragraph referred to glCallLists instead. glCallListsScalar is actually an SDL_perl extension (not part of core OpenGL) that provides an alternate calling convention for glCallLists in Perl. Internally, SDL_perl implements both Perl routines using the same underlying C function in OpenGL (glCallLists). SDL_perl provides two different calling conventions because Perl treats a string and an array of numbers as two different things, while C treats them as essentially the same.
If you want to render a string, and all of the characters in the string have codepoints <= 255 decimal (single-byte character sets, and the ASCII subset of most variable-width character sets), you can use glCallListsScalar, and it will do the right thing for you:
glCallListsScalar($string);
If you simply want to render several display lists with a single call, and you’re not trying to render a string, use the standard version of glCallLists:
glCallLists(@lists);
If you need to render a string, but it contains characters above codepoint 255, you have to use a more complex workaround:
glCallLists(map ord($_) =& split // =& $string);
Because the FPS counter merely renders ASCII digits, the first option works fine.
draw_frame now ends with a call to draw_fps, like so:
sub draw_frame
{
    my $self = shift;

    $self->set_projection_3d;
    $self->set_eye_lights;
    $self->set_view_3d;
    $self->set_world_lights;
    $self->draw_view;
    $self->draw_fps;
}
For now, I decided to turn off benchmark mode by changing the config setting in init_config to 0:
benchmark =& 0,
With the font handling in place, and draw_fps called each frame to display the frame rate in white in the lower-left corner, everything should be grand, as Figure 1 shows.
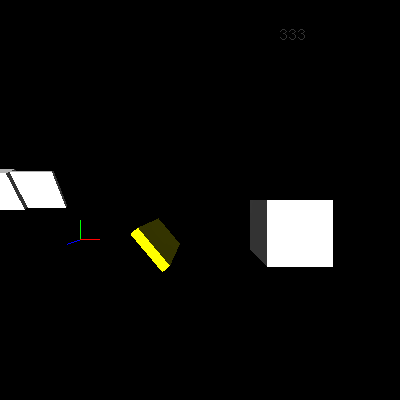 *Figure 1. Drawing the frame rate*
Oops. There’s no frame rate display. Actually, it’s there, just very faint. If you look very carefully (or turn your video card’s gamma up very high), you can just make out the frame rate display near the top of the window, above the big white box on the right. There are (at least) two problems–the text is too dark and it’s in the wrong place.
The first problem is reminiscent of the dark scene in the last article, after enabling lighting but no lights. Come to think of it, there’s not much reason to have lighting enabled just to display stats, but the last object rendered by draw_view left it on. To make sure lighting is off, I added a set_lighting_2d routine, which draw_frame now calls just before calling draw_fps:
sub set_lighting_2d
{
    glDisable(GL_LIGHTING);
}
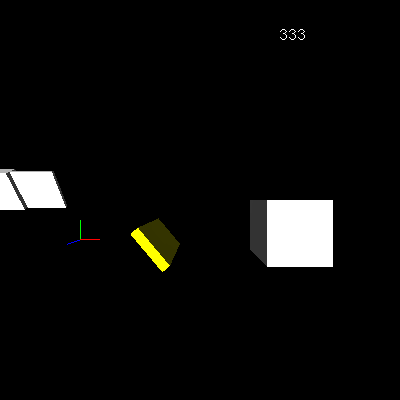 *Figure 2. The unlit frame rate*
Figure 2 is much better! With lighting turned off, the frame rate now renders in bright white as intended. The next problem is the incorrect position. Moving and rotating the viewpoint shows that while the digits always face the screen, their apparent position moves around (Figure 3).
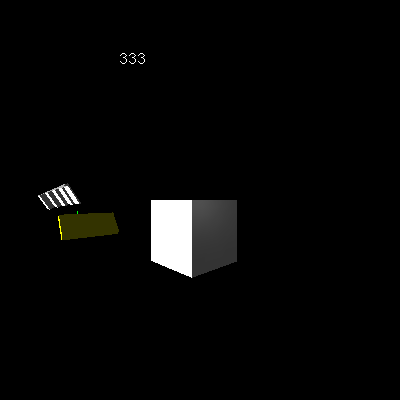 *Figure 3. A moving frame rate*
It turns out that the current modelview and projection matrices transform the raster position set by glRasterPos, just like the coordinates from a glVertex call. That means OpenGL reuses whatever state the modelview and projection matrices are in.
To get unaltered window coordinates, I need to use an orthographic projection (no foreshortening or other non-linear effects) matching the window dimensions. I also need to set an identity modelview matrix (so that the modelview matrix won’t transform the coordinates at all). All of this happens in set_projection_2d, called just before set_lighting_2d in draw_frame:
sub set_projection_2d
{
    my $self = shift;

    my $w    = $self->{conf}{width};
    my $h    = $self->{conf}{height};

    glMatrixMode(GL_PROJECTION);
    glLoadIdentity;
    gluOrtho2D(0, $w, 0, $h);

    glMatrixMode(GL_MODELVIEW);
    glLoadIdentity;
}
This routine first gathers the window width and height from the configuration hash. It then switches to the projection matrix (GL_PROJECTION) and restores the identity state before calling gluOrtho2D to create an orthographic projection matching the window dimensions. Finally, it switches back to the modelview matrix (GL_MODELVIEW) and restores its identity state as well. The frame rate now renders at the intended spot near the lower-left corner (Figure 4).
 *Figure 4. The frame rate in the correct position*
There is another more subtle rendering problem, however, which you can see by moving the viewpoint forward a bit (Figure 5).
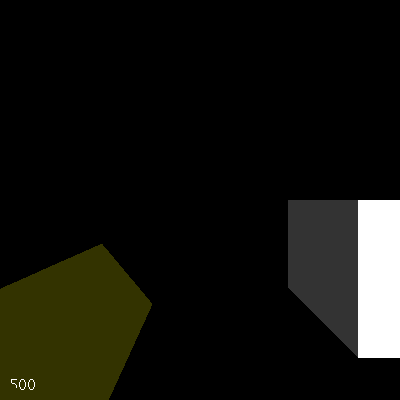 *Figure 5. Frame rate depth problems*
Notice how the “5” is partially cut off. The problem is that OpenGL compares the depth of the pixels in the thin yellow box to the depth of the pixels in the frame rate display, and finds that some of the pixels in the 5 are farther away than the pixels in the box. In effect, part of the 5 draws inside the box. In fact, moving the viewpoint slightly to the left from this point will make the frame rate disappear altogether, hidden by the near face of the yellow box.
That’s not very good behavior from a statistics display that should appear to hover in front of the scene. The solution is to turn off OpenGL’s depth testing, using a new line at the end of set_projection_2d:
glDisable(GL_DEPTH_TEST);
With this change, you can move the view anywhere without fear that the frame rate will be cut off or disappear entirely (Figure 6).
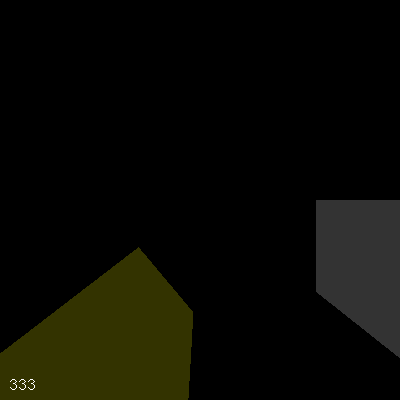 *Figure 6. Position-independent frame rate*
Too Fast
There’s yet another problem; this time, one that will require a change to the frame rate calculations. The frame rate shown in the above screenshots is either 333 or 500, but nothing else. On this system, the frames take between two and three milliseconds to render, but because SDL can only provide one-millisecond resolution, the time delta for a single frame will appear to be exactly either .002 second or .003 second. 1/.002=500, and 1/.003=333, so the display is a blur, flashing back and forth between the two possible values.
To get a more representative (and easier-to-read) value, the code must average frame rate over a number of frames. Doing this will allow the total measured time to be long enough to drown out the resolution deficiency of SDL’s clock.
The first thing I needed was a routine to initialize the frame rate data to carry over multiple frames:
sub init_fps
{
    my $self = shift;

    $self->{stats}{fps}{cur_fps}    = 0;
    $self->{stats}{fps}{last_frame} = 0;
    $self->{stats}{fps}{last_time}  = $self->{world}{time};
}
The new stats structure in the engine object will hold any statistics that the engine gathers about itself. To calculate FPS, the engine needs to remember the last frame for which it took a timestamp, as well as the timestamp for that frame. Because the engine calculates the frame rate only every few frames, it also saves the last calculated FPS value so that it can render it as needed. The init_fps call, as usual, goes at the end of init:
$self->init_fps;
The new update_fps routine now calculates the frame rate:
sub update_fps
{
    my $self      = shift;

    my $frame     = $self->{state}{frame};
    my $time      = $self->{world}{time};

    my $d_frames  = $frame - $self->{stats}{fps}{last_frame};
    my $d_time    = $time  - $self->{stats}{fps}{last_time};
    $d_time     ||= 0.001;

    if ($d_time >= .2) {
        $self->{stats}{fps}{last_frame} = $frame;
        $self->{stats}{fps}{last_time}  = $time;
        $self->{stats}{fps}{cur_fps}    = int($d_frames / $d_time);
    }
}
update_fps starts by gathering the current frame number and timestamp, and calculating the deltas from the saved values. Again, $d_time must default to 0.001 second to avoid possible divide-by-zero errors later on.
The if statement checks to see if enough time has gone by to result in a reasonably accurate frame rate calculation. If so, it sets the last frame number and timestamp to the current values and the current frame rate to $d_frames / $d_time.
The update_fps call must occur early in the main_loop, but after the engine has determined the new frame number and timestamp. main_loop now looks like this:
sub main_loop
{
    my $self = shift;

    while (not $self->{state}{done}) {
        $self->{state}{frame}++;
        $self->update_time;
        $self->update_fps;
        $self->do_events;
        $self->update_view;
        $self->do_frame;
    }
}
The final change needed to enable the new more accurate display is in draw_fps; the $d_time lookup goes away and the $fps calculation turns into a simple retrieval of the current value from the stats structure:
my $fps = $self->{stats}{fps}{cur_fps};
The more accurate calculation now makes it easy to see the difference between the frame rate for a simple view (Figure 7):
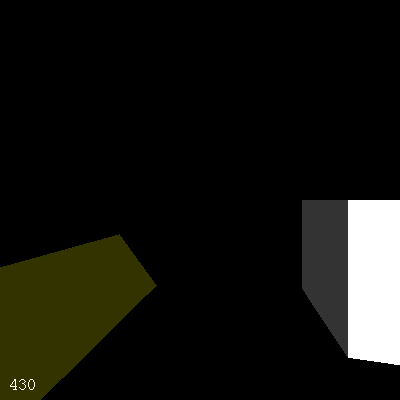 *Figure 7. Frame rate for a simple view*
and the frame rate for a more complex view (Figure 8).
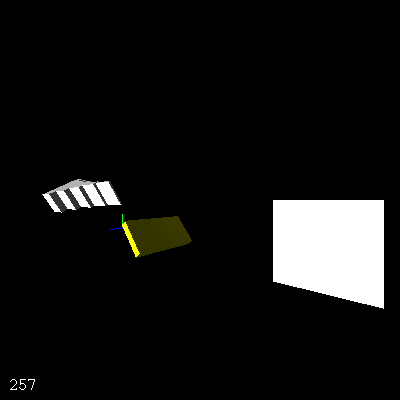 *Figure 8. Frame rate for a complex view*
Is the New Display a Bottleneck?
The last thing to do is to check that the shiny new frame rate display is not itself a major bottleneck. The easiest way to do that is to turn benchmark mode back on in init_conf:
benchmark =& 1,
After doing that, I ran the engine under dprofpp again, and then analyzed the results, just as I had earlier:
$ dprofpp -Q -p step075

Done.
$ dprofpp -I -g main::main_loop
Total Elapsed Time = 3.943764 Seconds
  User+System Time = 1.063773 Seconds
Inclusive Times
%Time ExclSec CumulS #Calls sec/call Csec/c  Name
 100.       -  1.064      1        - 1.0638  main::main_loop
 94.6   0.006  1.007    384   0.0000 0.0026  main::do_frame
 85.2   0.019  0.907    384   0.0000 0.0024  main::draw_frame
 50.7   0.205  0.540    384   0.0005 0.0014  main::draw_view
 16.8   0.073  0.179    384   0.0002 0.0005  main::draw_fps
 15.4   0.095  0.164    384   0.0002 0.0004  main::set_projection_2d
 11.6   0.045  0.124    384   0.0001 0.0003  main::draw_axes
 10.9   0.116  0.116   2688   0.0000 0.0000  SDL::OpenGL::CallList
 8.74   0.013  0.093    384   0.0000 0.0002  main::end_frame
 7.52   0.003  0.080    384   0.0000 0.0002  SDL::App::sync
 7.24   0.077  0.077    384   0.0002 0.0002  SDL::GLSwapBuffers
 4.89   0.052  0.052   3072   0.0000 0.0000  SDL::OpenGL::PopMatrix
 4.70   0.023  0.050    384   0.0001 0.0001  main::update_view
 3.67   0.039  0.039   3456   0.0000 0.0000  SDL::OpenGL::GL_LIGHTING
 3.48   0.037  0.037    384   0.0001 0.0001  SDL::OpenGL::Begin
As it currently stands, draw_view takes half of the run time of main_loop, and the combination of set_projection_2d and draw_fps takes about a third of the main_loop time together. Is that good or bad news?
draw_view is so quick now because I’ve just optimized it. Now that it’s running so fast again, I can afford to add more features and perhaps make a more complex scene, either of which will make draw_view take a larger percentage of the time again. Also, set_projection_2d is necessary for any in-window statistics, debugging, or HUD (heads up display) anyway, so the time spent there will not go to waste.
That leaves draw_fps, taking about one sixth of main_loop’s run time. That’s perhaps a bit larger than I’d like, but not large enough to warrant additional effort yet. I’ll save my energy for the next set of features.
Conclusion
During this article, I covered several concepts relating to engine performance: adding a benchmark mode; profiling with dprofpp; using display lists to optimize slow, repetitive rendering tasks; and using display lists, bitmapped fonts, and averaging to produce a smooth frame rate display. I also added a stub for a triggered events subsystem, which I’ll come back to in a future article.
With these performance improvements, the engine is ready for the next new feature, textured surfaces, which will be the main topic for the next article.
Until then, enjoy yourself and have fun hacking!
Tags
Feedback
Something wrong with this article? Help us out by opening an issue or pull request on GitHub


